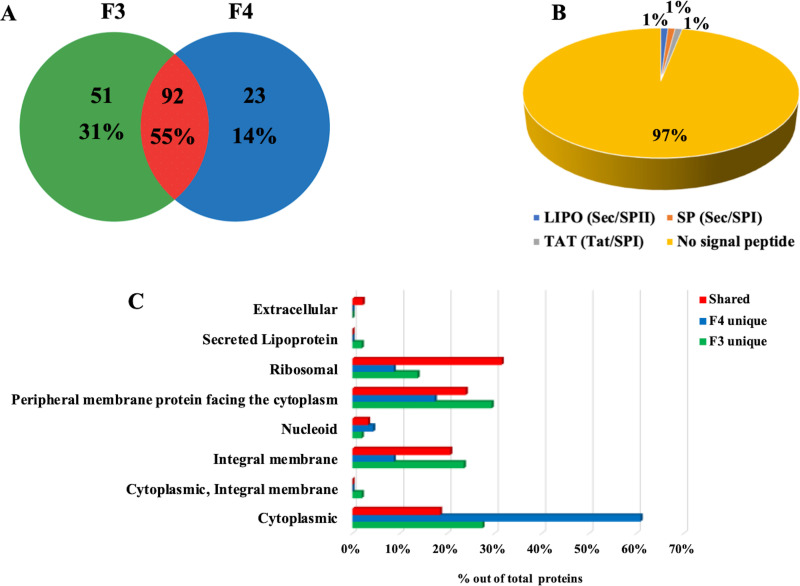
FIG 5.
S. coelicolor MVs are enriched in proteins. (A) Venn diagram showing the number of proteins present in MVs from fractions F3 and F4, as identified by SDS-PAGE, proteomics, and bioinformatics. Percentage values refer to the total number of all proteins identified. (B) Prediction of the presence of signal peptide cleavage sites in proteins identified in bacterial MVs. Sec signal peptide (Sec/SPI; gray); lipoprotein signal peptide (Sec/SPII; blue); Tat signal peptide (Tat/SPI; orange); no signal peptide (yellow). (C) Predicted subcellular localization of proteins exclusively present in either F3 or F4 MVs (“F3 unique” and “F4 unique”) or shared between the F3 and F4 MVs (“shared”). Percentage values refer to the total number of proteins identified in each fraction or shared.

