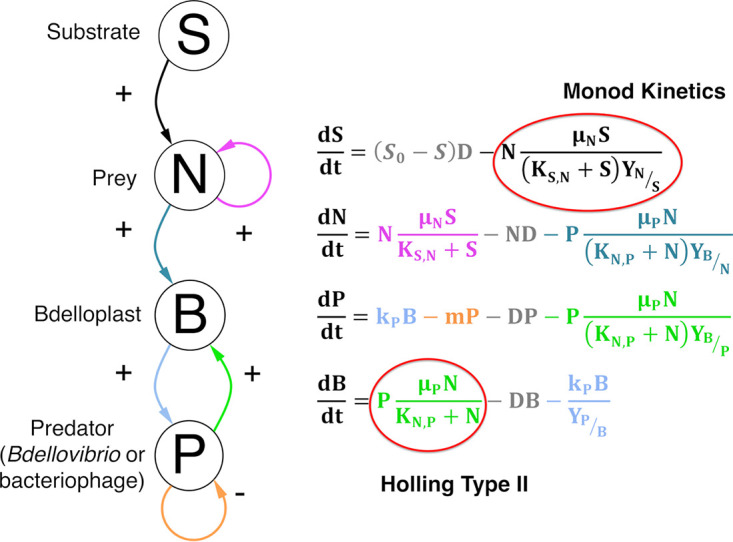
FIG 1.

Principal model used to track predator and prey densities under chemostat conditions (Model 6, see Table S2) with color-coded interaction arrows and equation terms. Substrate is consumed (black) by prey to fuel growth (purple). Prey (teal) and predators (green) combine to form a bdelloplast. The bdelloplast matures to give new predators (light blue). Predators have mortality (orange). All species are diluted at the same rate (gray). This is the model used unless stated otherwise.
