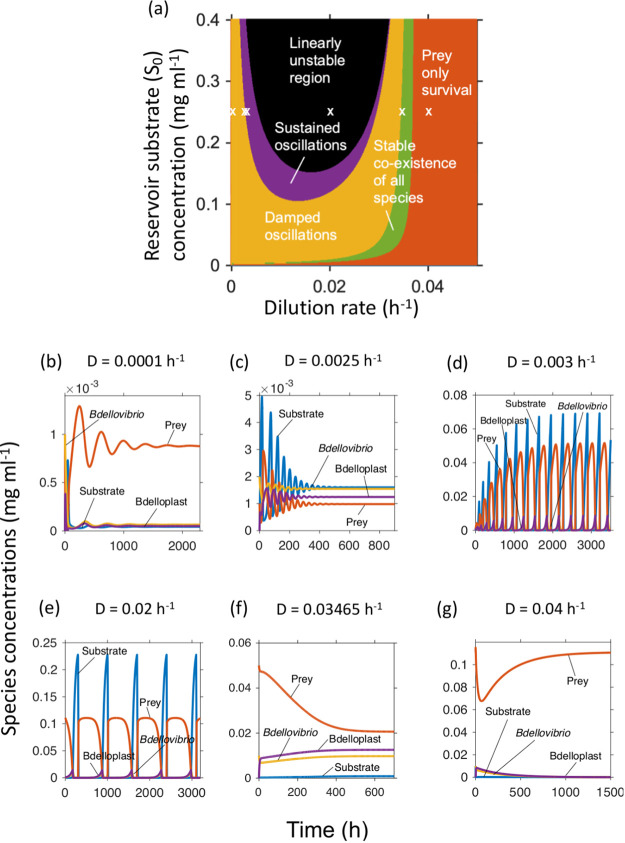
FIG 2.
Dynamic regimes of Model 6. (a) Analytically calculated regimes, as depending on the inflow substrate concentration S0 and dilution rate D. (b–g) Simulations at S0 = 0.25 mg ml−1 and increasing dilution rates, indicated by white crosses in panel (a). (b) Damped oscillations that ended in steady state co-existence. c Damped oscillations of much shorter period than panel (b). (d) Amplifying oscillations that ended in sustained, extreme oscillations. (e) The analytically predicted linearly unstable region gave sustained, extreme oscillations in the numerical simulations. (f) Stable co-existence of predator and prey. (g) Predator extinction.

