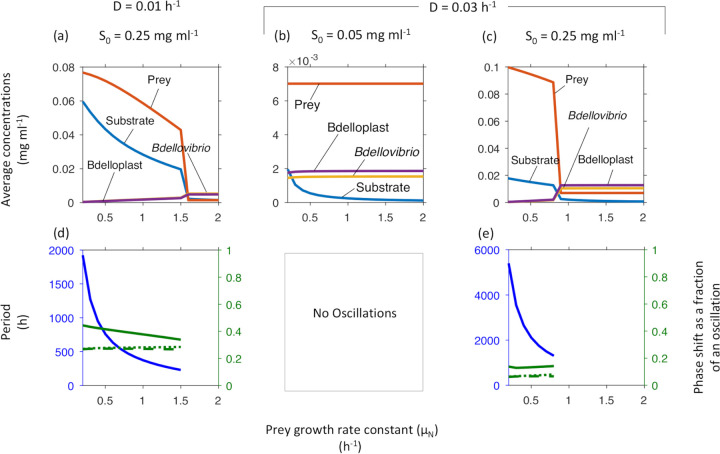
FIG 3.
Increasing the maximal specific growth rate of the prey (μN) leads to a sharp drop in prey density and stabilizes the system at high inflow substrate concentrations (S0). The system was more stable at low S0 (cf. phase diagram in Fig. 2a). Top row shows concentrations at steady state or averaged over one oscillatory cycle. Bottom row shows the oscillatory period (blue, left axis) and phase shifts (green, right axis) from substrate peak to peak of prey (solid line), free Bdellovibrio (dashed line) or bdelloplast (dotted line). Note that oscillations occur at the higher S0 and below a critical μN. Prey density is much higher in the oscillatory regimes, where it decreases with increasing μN. Since prey density will of course be 0 if μN is zero, there is an optimal μN.

