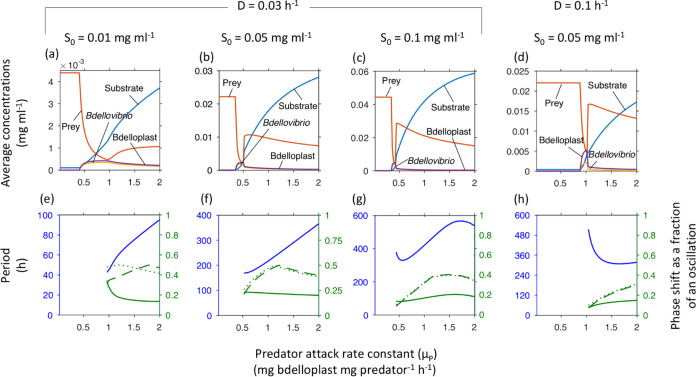
FIG 4.
Minimal and optimal attack rate constant (μP). The average population densities and substrate concentrations, oscillatory periods and phase shifts strongly depend on μP, shown at increasing inflow substrate concentrations (S0) and two dilution rates (cf. phase diagram in Fig. 2a). Top row shows concentrations at steady state or averaged over one oscillatory cycle. Bottom row shows the oscillatory period (blue, left axis) and phase shifts (green, right axis) from substrate peak to peak of prey (solid line), free Bdellovibrio (dashed line) or bdelloplast (dotted line). Note that oscillations start above the optimal μP. To obtain accurate simulation results at all parameter values, the absolute tolerance of the ode45 solver had to be reduced from 1 × 10⁻⁹ to 1 × 10⁻¹².

