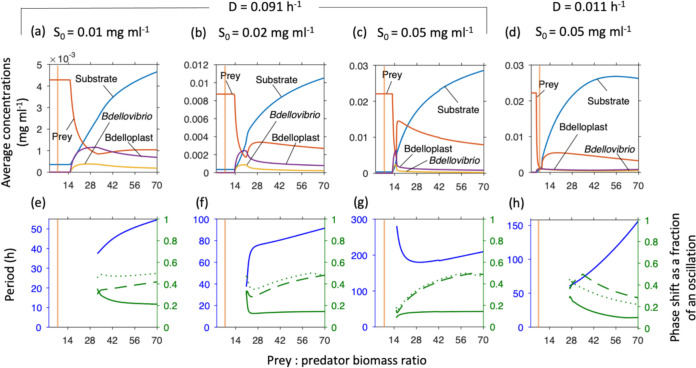
FIG 5.
Minimal and optimal prey biomass, relative to predator biomass (0.028 pg dry biomass predator cell−1). Predator density showed a broad optimum at low inflow substrate concentrations (S0) that became narrower at higher S0 and dilution rate. Too large prey caused oscillations. Top row shows concentrations at steady state or averaged over one oscillatory cycle. Bottom row shows the oscillatory period (blue, left axis) and phase shifts (green, right axis) from substrate peak to peak of prey (solid line), free Bdellovibrio (dashed line) or bdelloplast (dotted line). The vertical orange line, at a prey/predator ratio of 7, is the biomass ratio between an average E. coli and Bdellovibrio and similar to most prey used in laboratory studies or for isolating Bdellovibrio from the environment.

