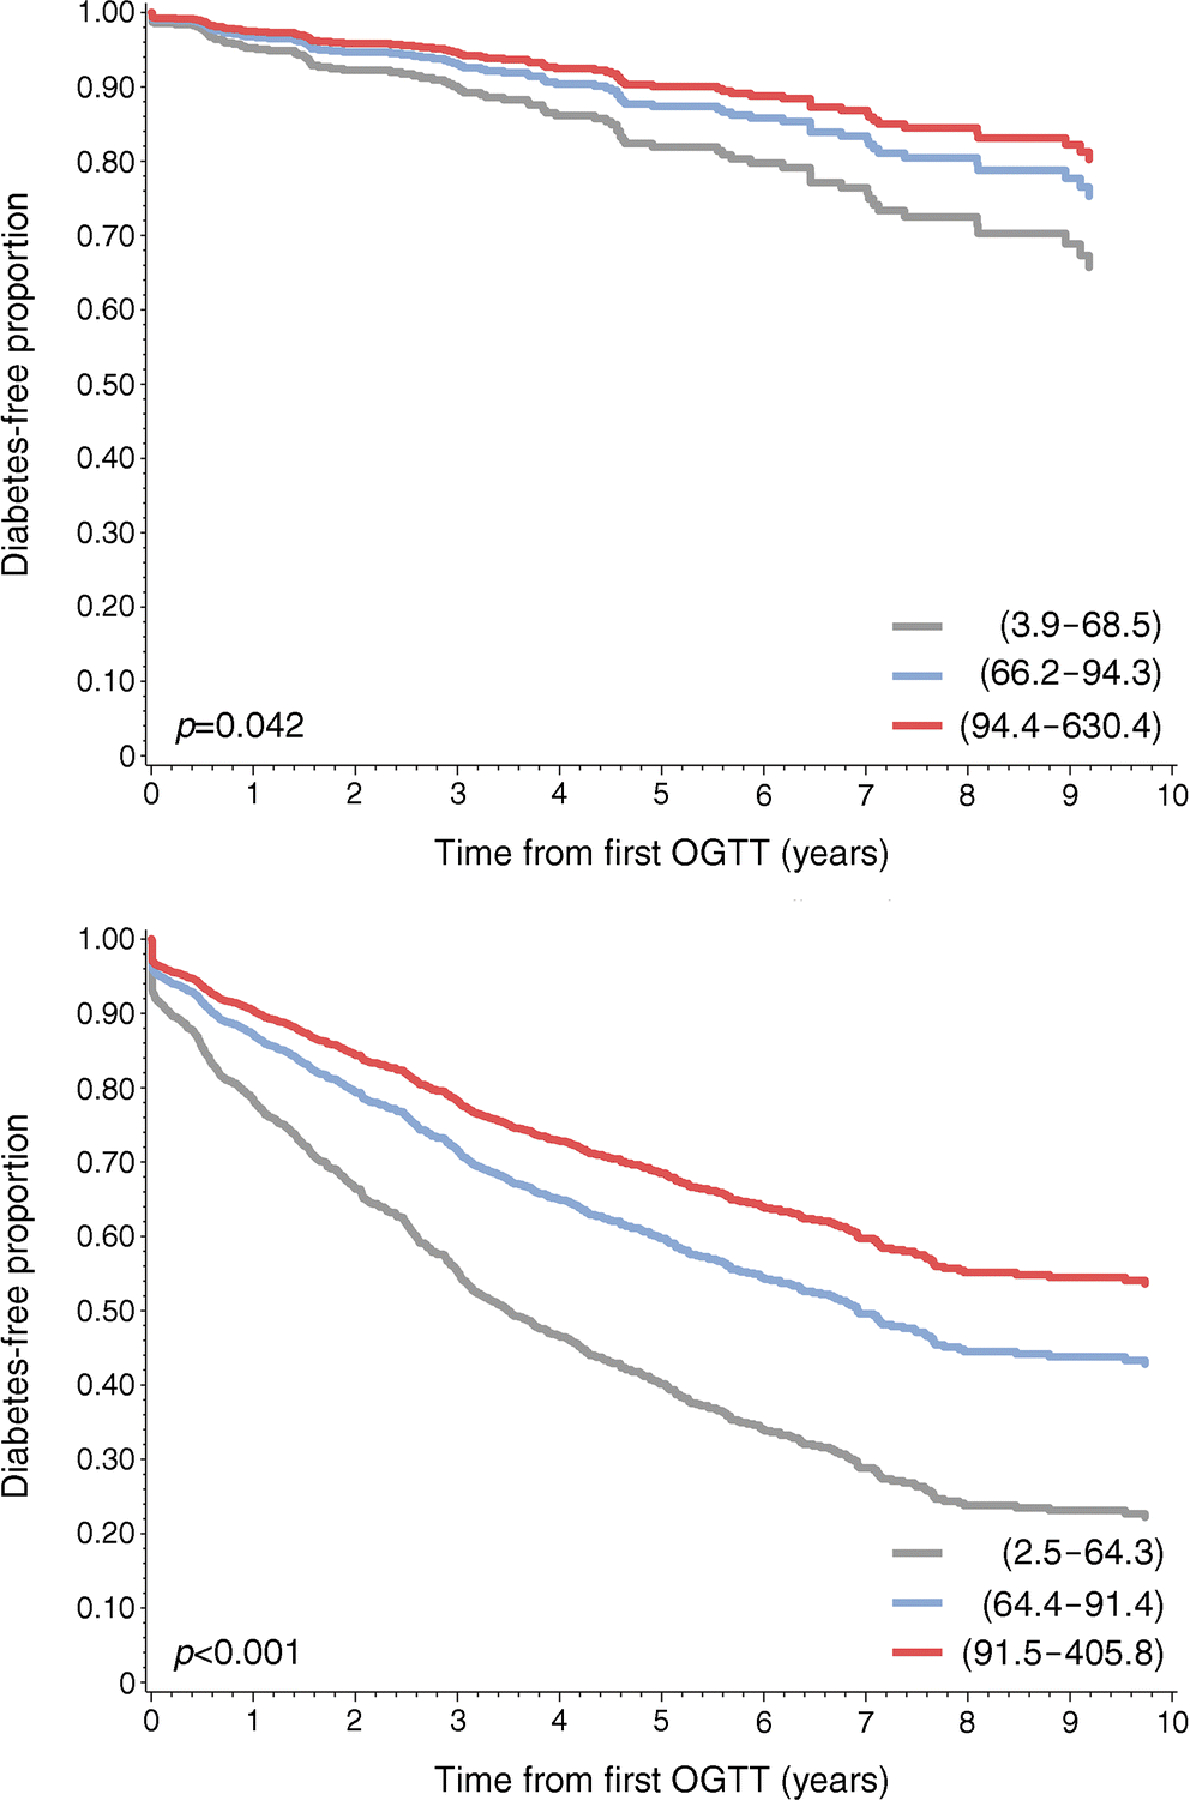
Fig. 3.

Lower HOMA2-B tertiles correlate with increased risk for type 1 diabetes. Cox proportional hazards regression analysis by autoantibody status for single-Aab+ (a) and multiple-Aab+ (b) cohorts with adjustment for age, sex, HLA status and BMI z score. The lowest HOMA2-B tertile corresponds with the highest type 1 diabetes development risk for single- and multiple-Aab+ cohorts. Grey lines, bottom tertile; blue lines, middle tertile; red lines, top tertile. HOMA2-B ranges for the corresponding tertiles are indicated in parentheses. p values were determined by logrank test
