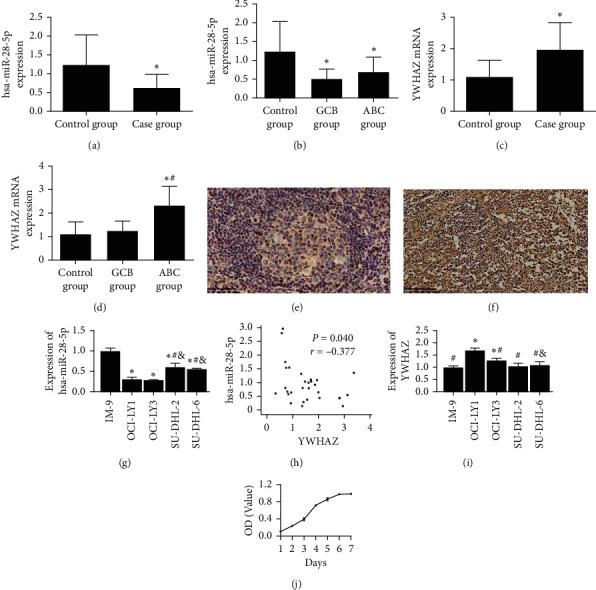
Figure 1.

Downregulation of hsa-miR-28-5p and upregulation of YWHAZ in fresh tissues of DLBCL patients were tested by qRT-PCR. (a) Expression levels of hsa-miR-28-5p in the case group were lower than those in the control group (reactive hyperplasia of lymph nodes group). (b) Expression levels of hsa-miR-28-5p in the GCB group were lower than those in the ABC group. (c) Expression levels of YWHAZ in human DLBCL tissues were higher than those in reactive hyperplasia of lymph nodes. (d) Expression levels of YWHAZ in the ABC group were higher than those in the GCB group. (e) (EnVision method, original magnification x400) In reactive hyperplasia of lymph nodes tissue, YWHAZ expressed negatively. (f) (EnVision method, original magnification x400) YWHAZ expressed on oncocytes: the YWHAZ expression was positive in the cytoplasm and cell membrane of the tumor cells. (a–d) ∗p < 0.05 versus the control group; #p < 0.05 versus the GCB group. (g) Expression levels of hsa-miR-28-5p were lower in DLBCL cell lines. (h) YWHAZ was negatively correlated with hsa-miR-28-5p, and the correlation coefficient was −0.377 (p=0.040). (i) Expression levels of YWHAZ were higher in DLBCL cell lines. (j) The OCI-LY1 cell line grew well, and it was chosen for our experiment. (g, i) ∗p < 0.05 versus the IM-9 group; #p < 0.05 versus the OCI-LY1 group; & p < 0.05 versus the OCI-LY3 group (one-way ANOVA).
