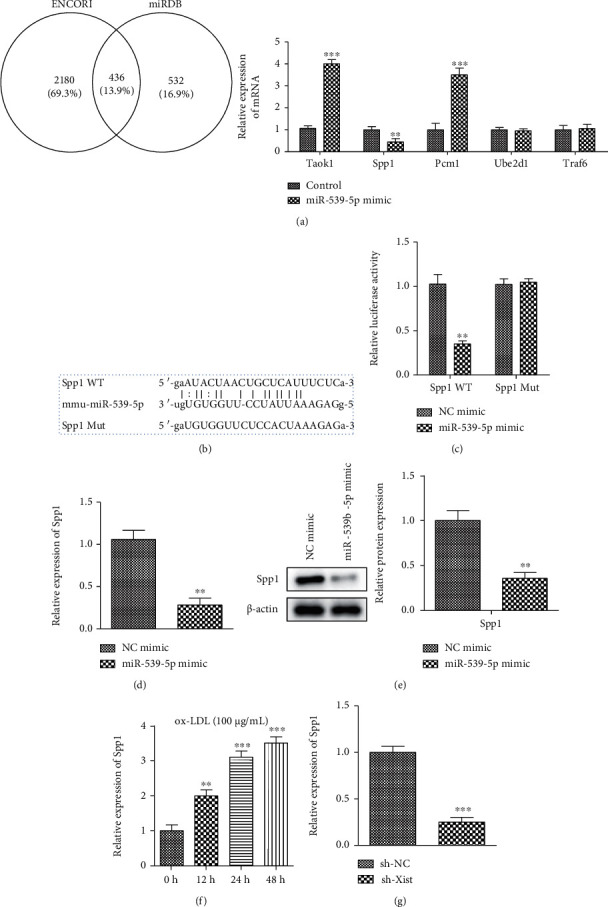
Figure 6.

Targeting the relationship between miR-539-5p and SPP1. (a) The possible downstream targets of miR-539-5p (ENCORI and miRDB) by kinds of silica gel prediction algorithms. The mRNA expression levels of relative target genes in cells. (b) The binding sites of miR-539-5p and SPP1 were predicted by a bioinformatics website. (c) The targeting relationship between miR-539-5p and SPP1 was determined by dual luciferase report assay. (d) The bar graph showed changes of SPP1 mRNA expression level in NC mimic group vs. miR-539-5p mimic group in VSMCs, ∗∗P < 0.01. (e) Western blot analysis showed the protein levels of SPP1 in NC mimic group vs. miR-539-5p mimic group in VSMCs. (f, g) The mRNA expression level of SPP1 in VSMCs in a dose- and time-dependent manner of ox-LDL, ∗∗P < 0.01, ∗∗∗P < 0.001.
