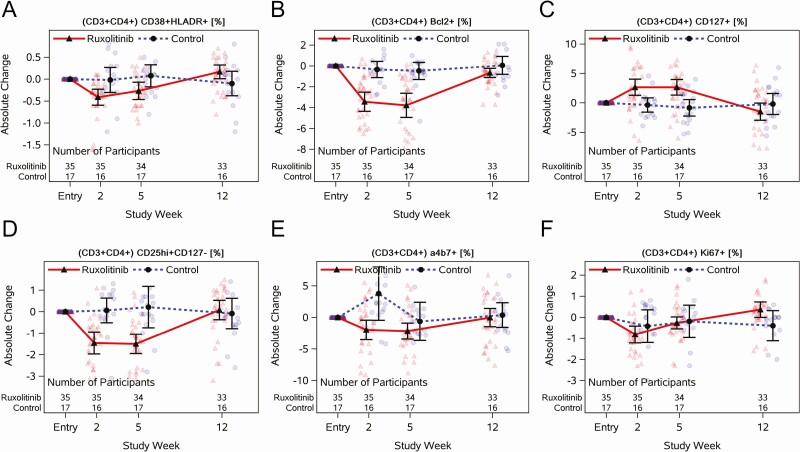
Figure 2.
Longitudinal jitter plots of changes in plasma cytokines with or without 5 weeks of ruxolitinib for individuals virologically suppressed on antiretroviral therapy. Interleukin (IL)–6 (A), soluble CD14 (sCD14; B), tumor necrosis factor alpha (TNF-α; C), IL-1β (D), IL-7 (E), and IL-10 (F) measured at preentry and entry, and weeks 2, 4, 5, 10, and 12, depending on the marker (see x-axis); baseline is the average of preentry and entry, week 4/5 is the average of weeks 4 and 5, and week 10/12 is the average of weeks 10 and 12. Black circles and triangles represent the geometric mean, and error bars represent 95% confidence intervals. Jittered data points are shown as transparent circles and triangles.

