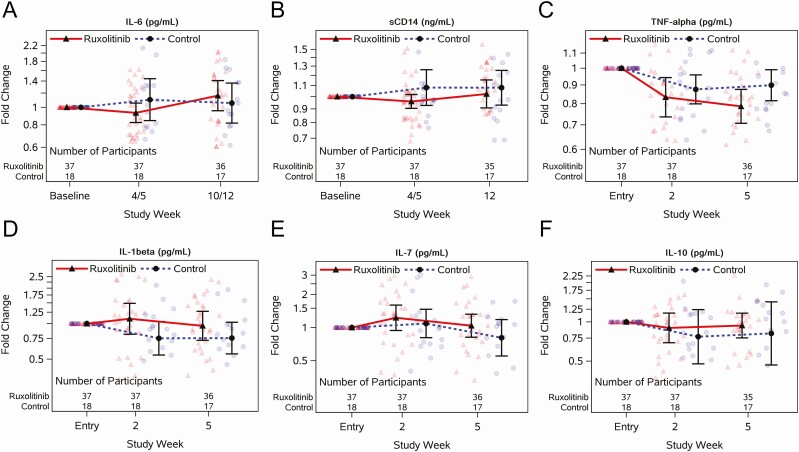
Figure 4.
Longitudinal jitter plots of changes in T-cell subsets with or without 5 weeks of ruxolitinib for individuals virologically suppressed on antiretroviral therapy. CD4 absolute count (A) and CD8 absolute count (B) measured at preentry and entry, and weeks 2, 5, and 12; baseline is the average of preentry and entry. Black circles and triangles represent the mean and error bars represent 95% confidence intervals. Jittered data points are shown as transparent circles and triangles.

