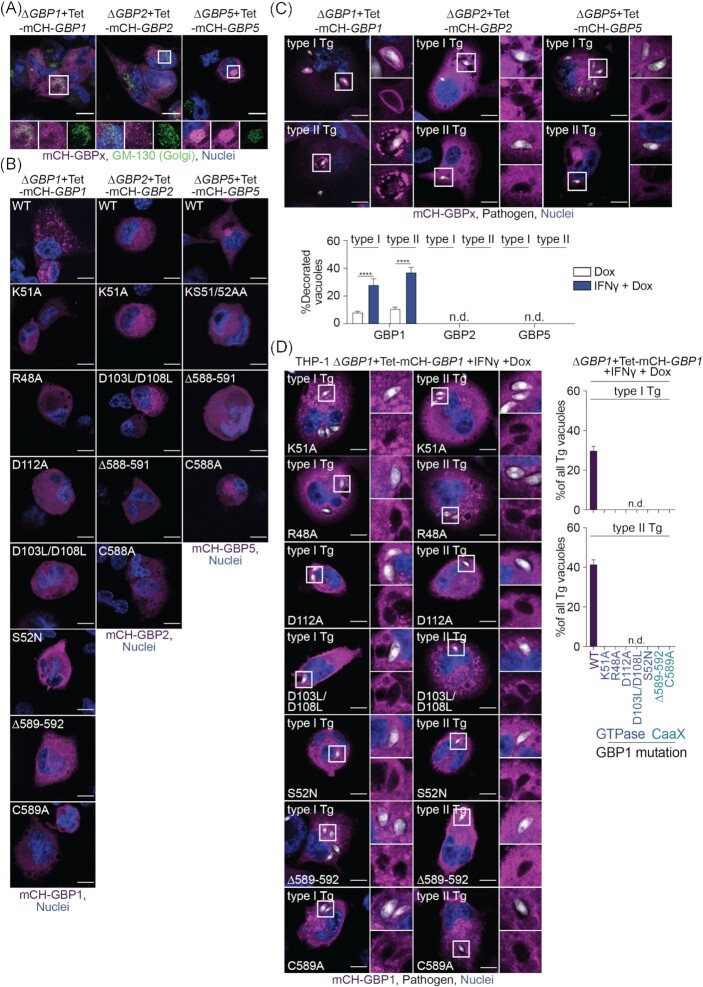
Figure 4.
GBP2 and 5 do not localize to Toxoplasma vacuoles. (A) Immunofluorescence images of THP-1∆GBP1+Tet-mCH-GBP1, ∆GBP2+Tet-mCH-GBP2 or ∆GBP5+Tet-mCH-GBP5 cells treated with IFNγ and Doxycycline (Dox) and stained for Golgi marker GM-130 to illustrate Golgi localization of GBP5 in uninfected cells. Magenta: mCherry (mCH)-GBP1/2/5; green: GM-130 (Golgi) and blue: nuclei. Scale bar, 10 μm. (B) Immunofluorescence images of THP-1∆GBP1+Tet-mCH-GBP1, ∆GBP2+Tet-mCH-GBP2 or ∆GBP5+Tet-mCH-GBP5 cells expressing the indicated GBPx mutant treated with IFNγ+Dox to illustrate localization of the respective protein in uninfected cells. Magenta: mCherry (mCH)-GBP1/2/5 and blue: nuclei. Scale bar, 10 μm. (C) Immunofluorescence images (top) and HRMAn-based quantification of GBP recruitment to Tg (bottom) in THP-1∆GBP1+Tet-mCH-GBP1, ∆GBP2+Tet-mCH-GBP2 or ∆GBP5+Tet-mCH-GBP5 cells treated with IFNγ+Dox and infected with type I (RH) or type II (PRU) T. gondii (Tg) for 6 h. Magenta: mCherry (mCH)-GBP1/2/5; grey: Tg and blue: nuclei. Scale bar, 10 μm. (D) Images (left) and HRMAn-based quantification of GBP1 recruitment to Tg-vacuoles (right) in THP-1∆GBP1+Tet-mCH-GBP1 cells expressing the indicated GBP1 mutant treated with IFNγ+Dox and infected for 6 h. Magenta: mCherry (mCH)-GBP1; grey: pathogen and blue: nuclei. Scale bar, 10 μm. Data information: images in (A + C-D) representative of n = 3 and in (B) representative of n = 2 independent experiments. Graph in (C + D) show mean ± SEM from n = 3 independent experiments. ****P ≤ 0.0001 for indicated comparisons in (C) from one-way ANOVA comparing to Dox-only treated cells following adjustment for multiple comparisons; n.d. not detected.

