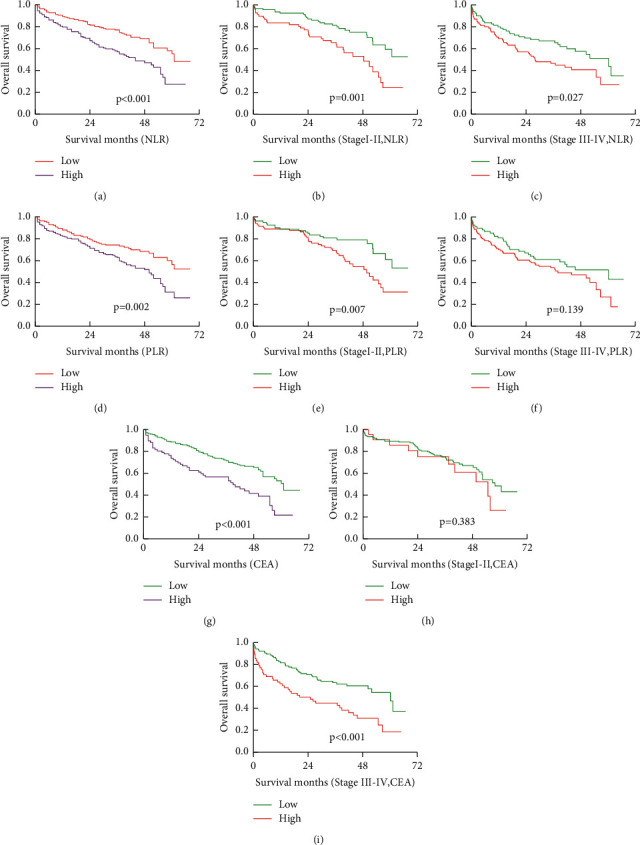
Figure 2.

Kaplan–Meier estimates of overall survival (OS) according to the NLR, PLR, and CEA.:(a) according to NLR (P < 0.001), (b) according to NLR in stage I-II (P=0.001), (c) according to NLR in stage III-IV (P=0.027), (d) according to PLR (P=0.002), (e) according to PLR in stage I-II (P=0.007), (f) according to PLR in stage III-IV (P=0.139), (g) according to CEA (P < 0.001), (h) according to CEA in stage I-II (P=0.383), (i) according to NLR in stage III-IV (P < 0.001).
