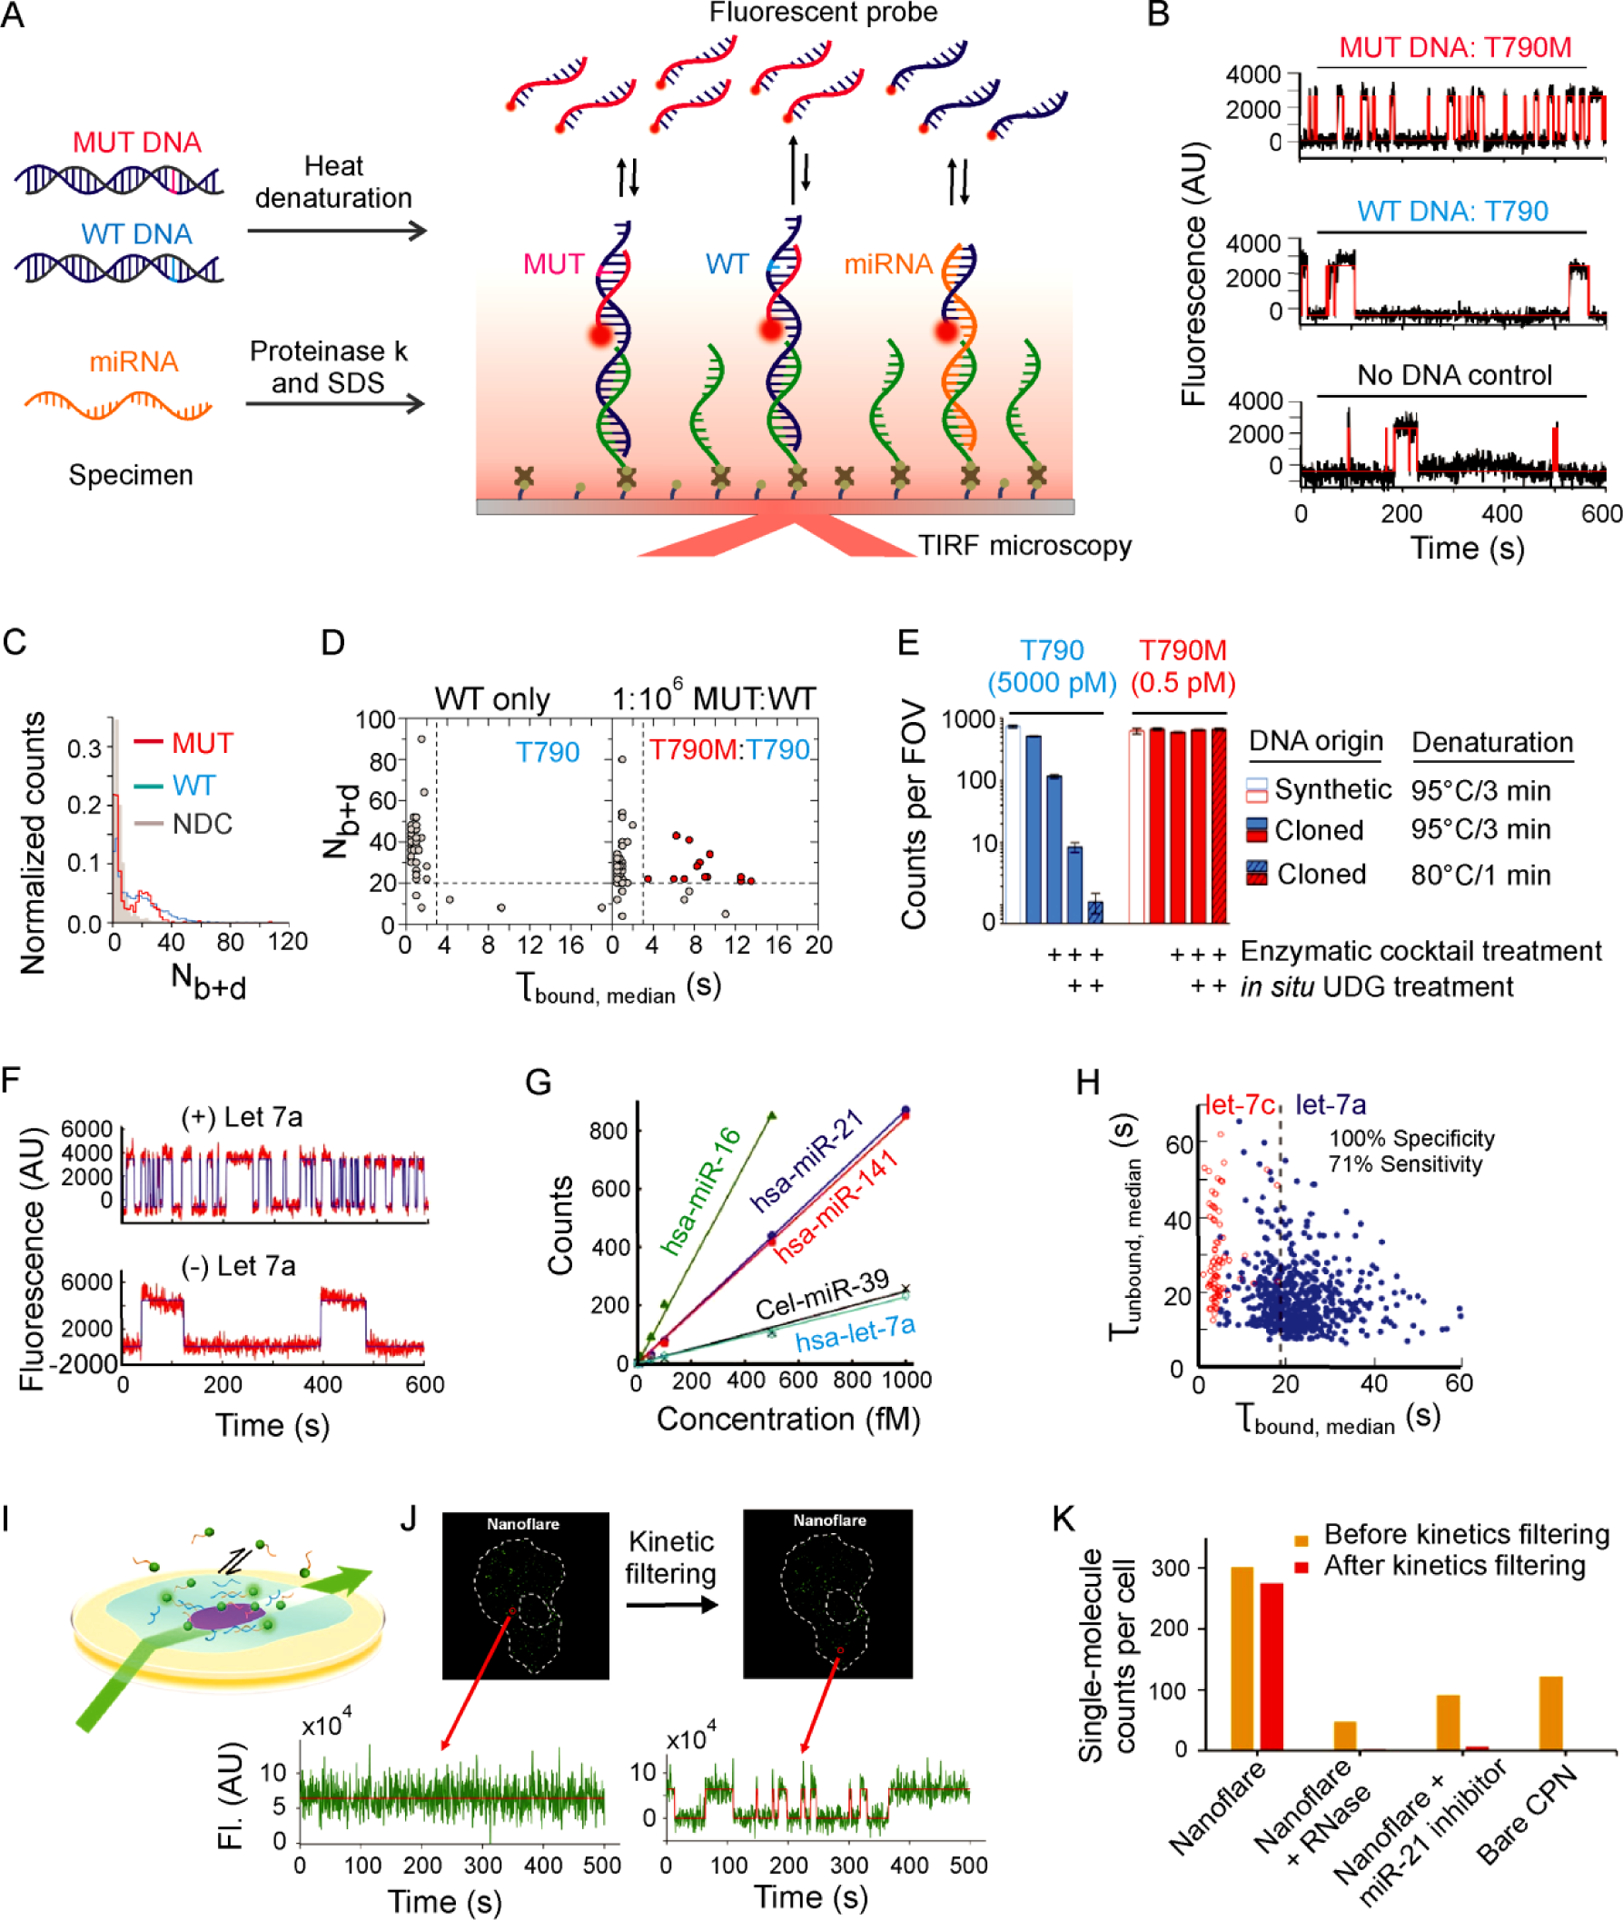
Figure 3.

Highly specific and sensitive detection of nucleic acid biomarkers with single-molecule kinetic fingerprinting (SiMREPS). (A) Experimental scheme for SiMREPS assays of DNA and miRNA. (B) Representative single-molecule kinetic traces for MUT DNA (top), WT DNA (middle), and a no-DNA control (bottom) using an FP specific for the EGFR mutation T790M (c.2369C>T). (C) Histogram comparing the number of binding and dissociation events (Nb+d) observed per single-molecule trace for a no-DNA control (NDC), T790 (WT, 50 nM), and T790M (MUT, 50 fM). (D) Kinetic thresholding based primarily on Nb+d and τbound,median distinguishes between samples containing WT only and a 1:106 mixture of MUT and WT sequence. (E) Varying heat denaturation conditions and enzymatic treatments of T790 (WT, blue) and T790M (MUT, red) demonstrate the impact of spontaneous heat-induced cytosine deamination on specificity. B-E reproduced with permission from ref 2, Copyright 2018, American Chemical Society. (F) Representative single-molecule kinetic traces for in vitro detection of miRNA (hsa-let-7a). (G) Standard curves for in vitro detection of five different miRNAs. (H) Dwell time analysis enables high-confidence discrimination between let-7a and let-7c. F-H reproduced with permission from ref 1, Copyright 2015, Springer Nature. (I) Experimental scheme for HILO imaging of single cells using a miR-21-specific nanoflare SiMREPS probe. (J) Time traces illustrating the ability to distinguish single miR-21 molecules from background binding in a single A549 cell. (K) Apparent single-molecule counts from SiMREPS assays of miR-21 under different experimental conditions with and without kinetic filtering. I-K reproduced with permission from ref 14, Copyright 2019, American Chemical Society.
