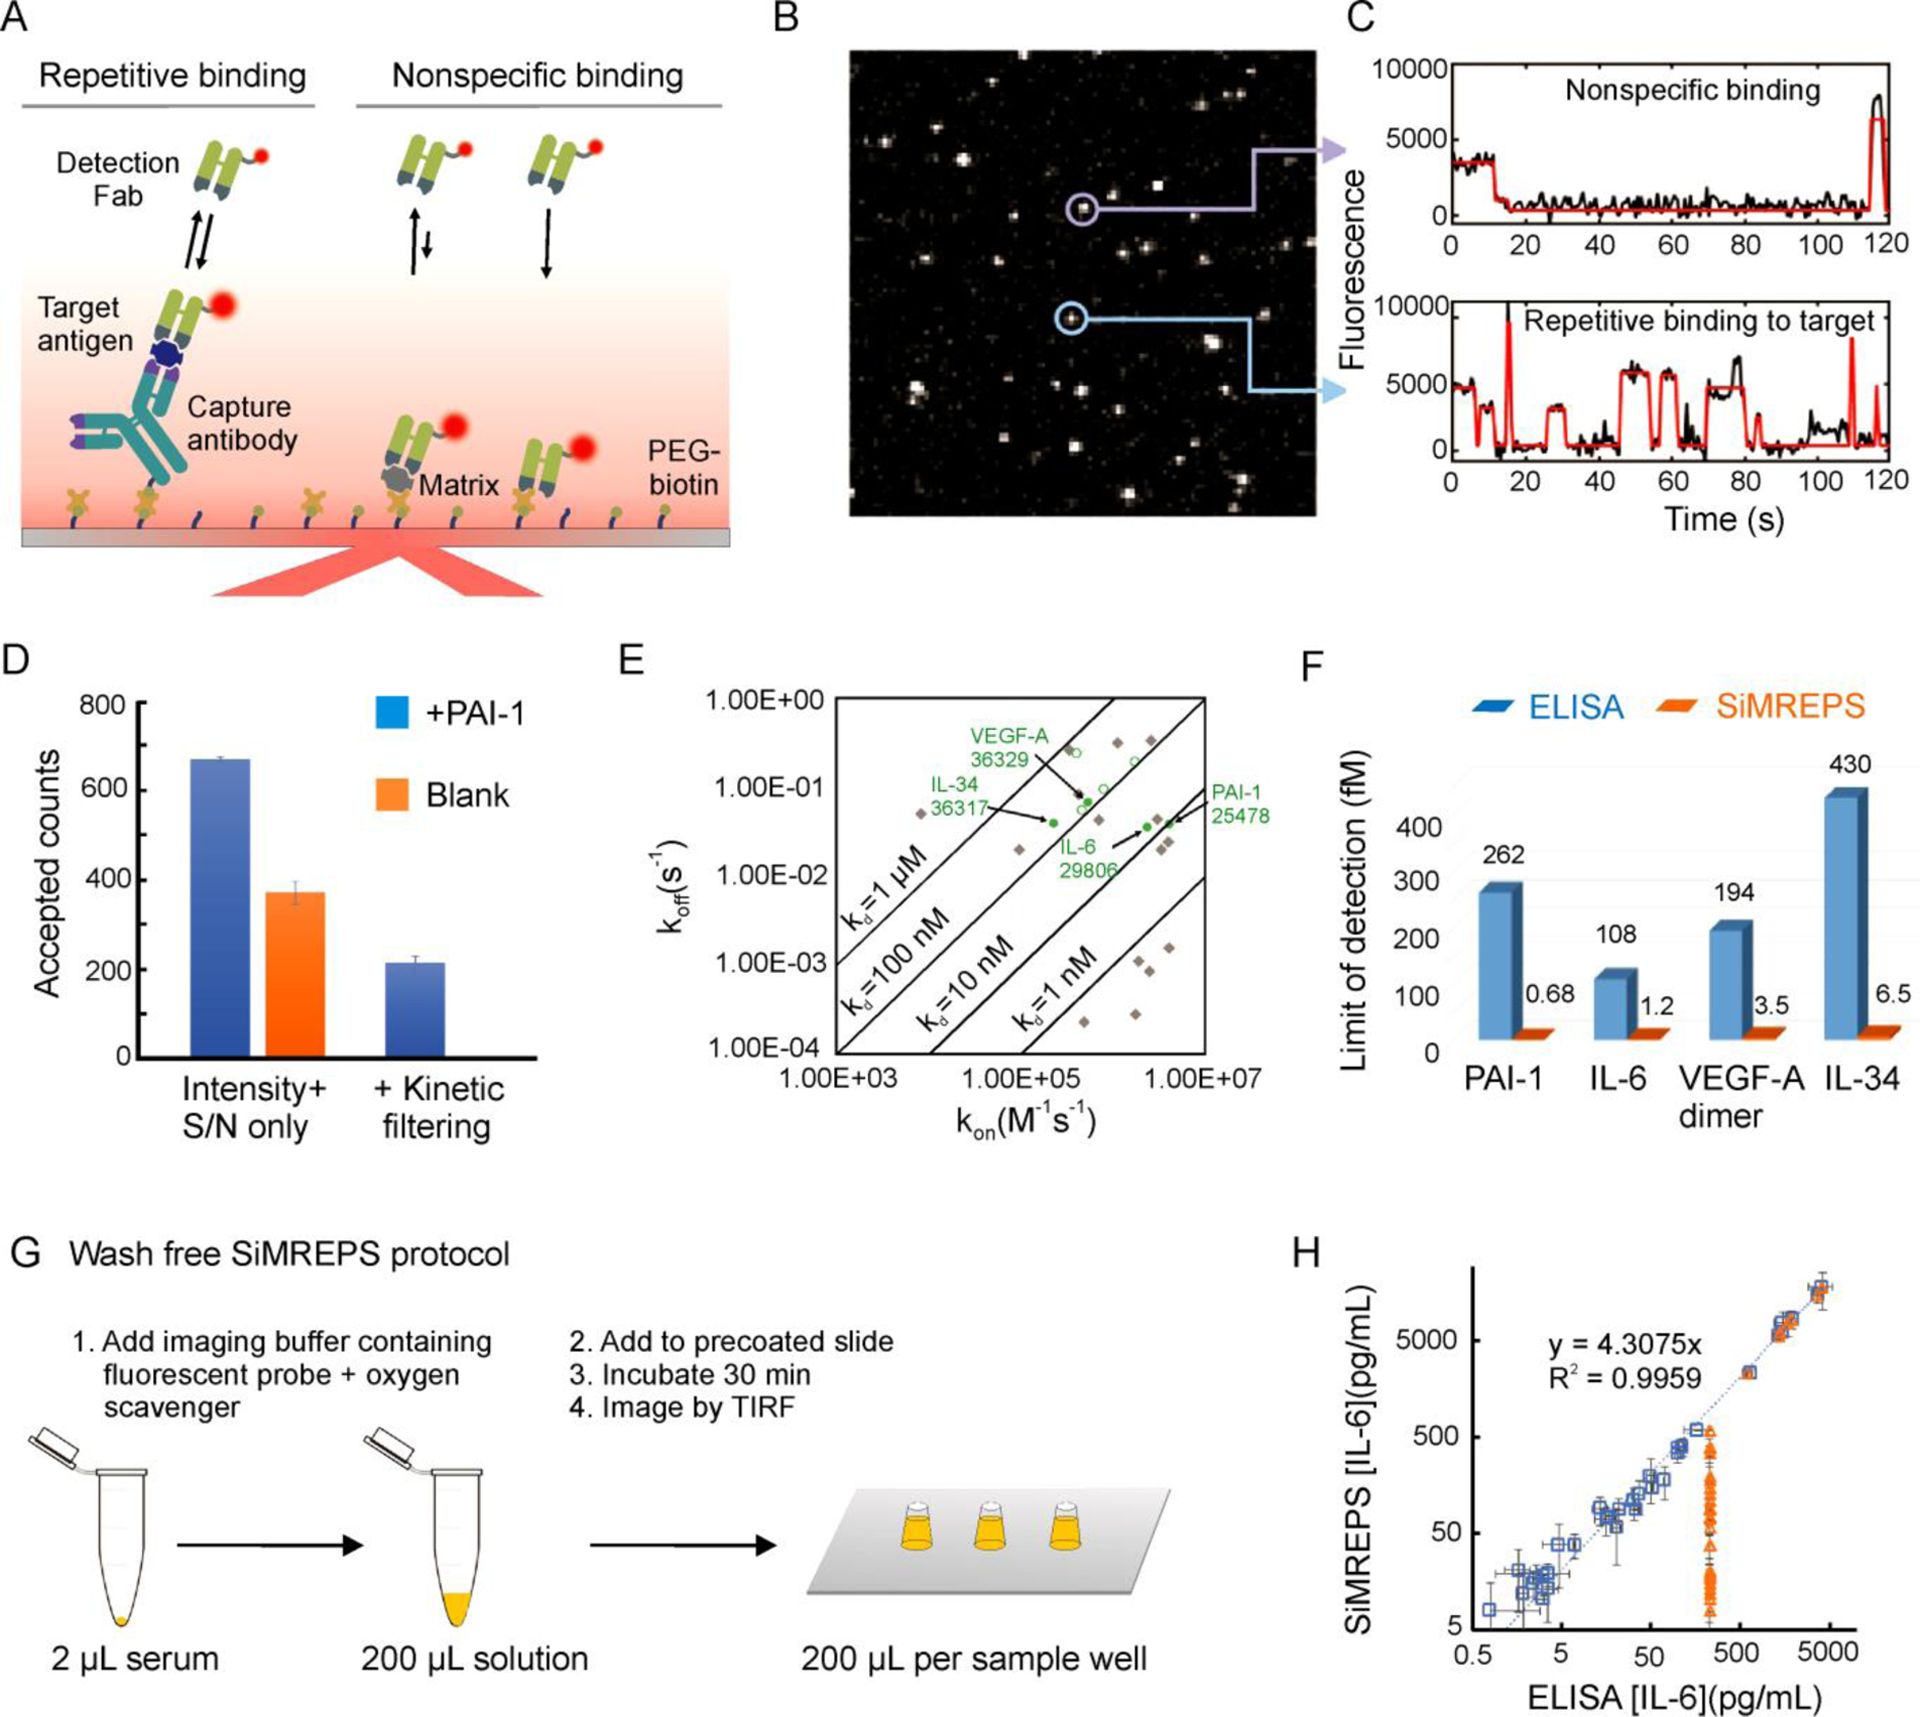
Figure 4.

High-confidence detection and counting of single protein molecules by SiMREPS. (A) Experimental scheme for the detection of target protein antigens by SiMREPS. (B) Single movie frame of a representative microscope FOV; the bright puncta represents single FPs bound at or near the coverslip surface. (C) Representative intensity-versus-time traces showing the distinct kinetic fingerprints of non-specific binding (top) and repetitive binding to the target antigen (bottom). (D) Impact of kinetic filtering on the number of accepted counts in animal serum samples with and without the spiked-in antigen PAI-1. (E) Scatter plot of binding (kon) and dissociation (koff) rate constants (determined from BLI or SPR measurements) of candidate detection Fabs, with their success or failure as SiMREPS probes at room temperature indicated by color (not suitable: gray diamonds; suitable: green circles; suitable and chosen for final assays: filled green circles). (F) Bar graph showing the superior sensitivity of SiMREPS (orange bars) compared to ELISA (blue bars) for the same antigens. (G) Wash-free SiMREPS protocol for quantifying IL-6 in serum. (H) Correlation plot of endogenous IL-6 measurements by the wash-free protocol in 34 patient-derived serum samples by SiMREPS (100-fold dilution of all samples) and ELISA with variable dilution factors (4-fold dilution, closed blue squares; 64-fold dilution, open blue squares) or ELISA with 100-fold dilution of all samples (orange triangles).
