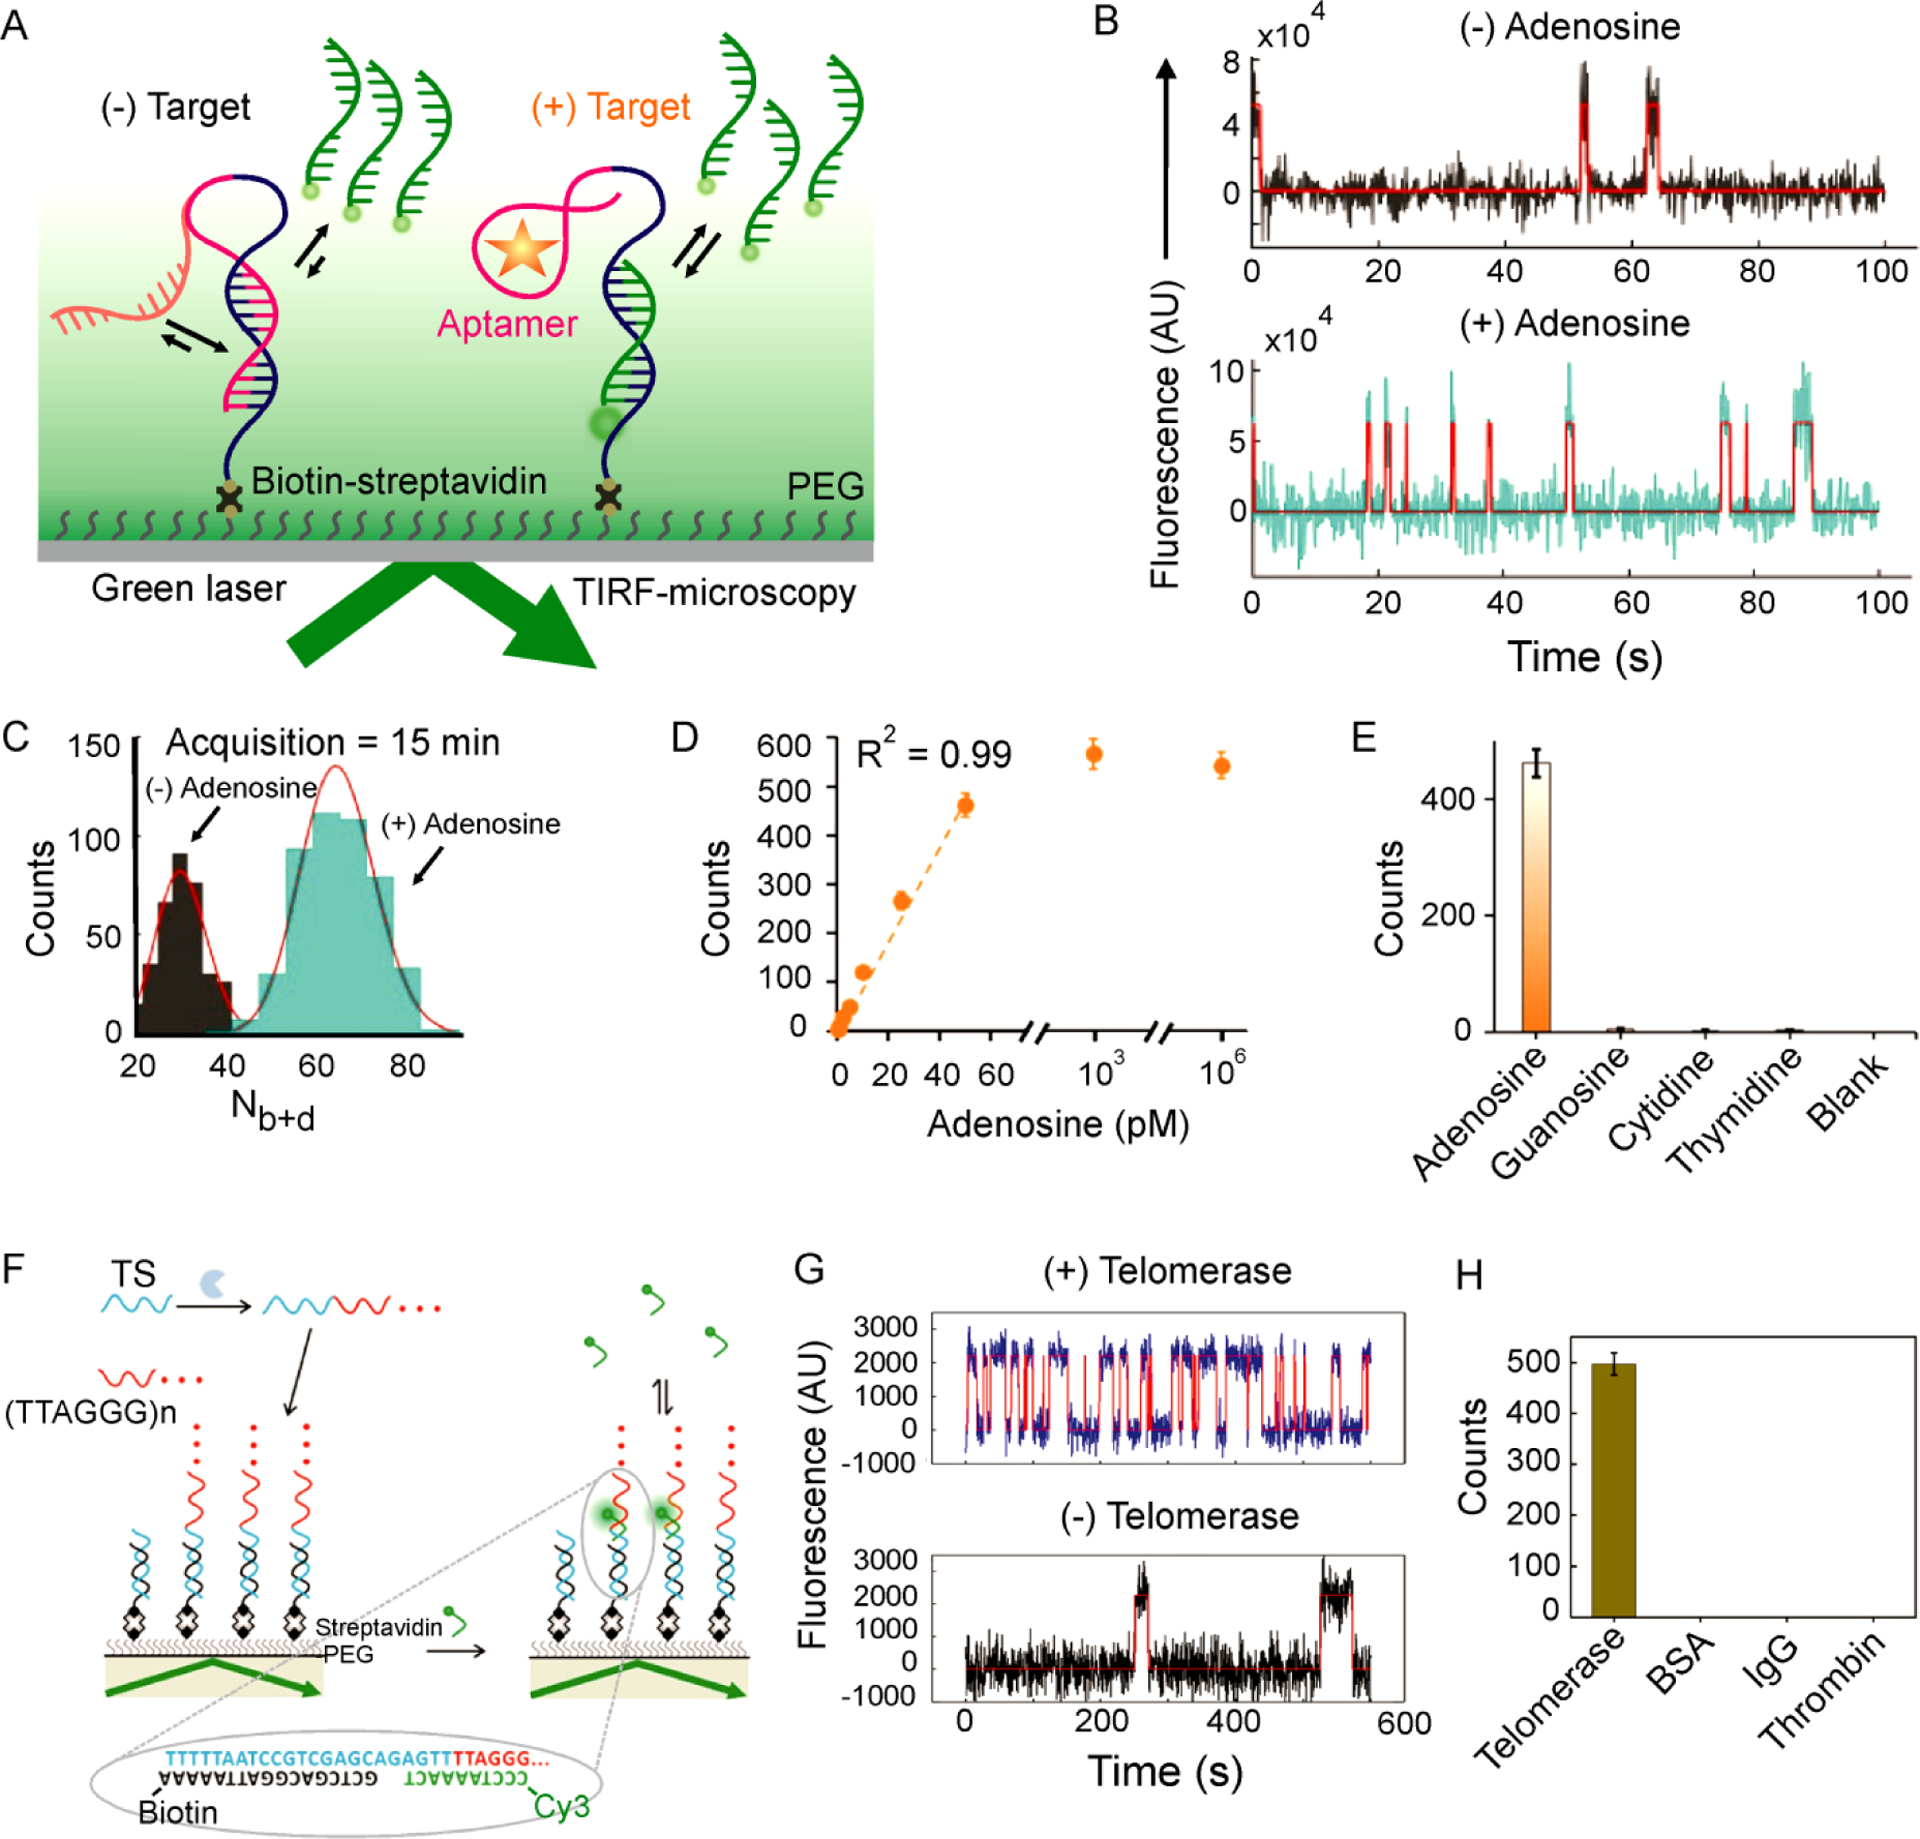
Figure 5.

Detection of small molecules and monitoring enzyme activity using SiMREPS. (A) Experimental scheme showing the use of SiMREPS to probe the state of an aptamer for the high-sensitivity detection of small molecules by TIRF-microscopy. (B) Representative intensity-versus-time traces in the absence and presence of adenosine (50 pM). (C) Histograms of Nb+d in the absence (gray) or presence (cyan) of adenosine (50 pM). (D, E) Standard curve (D) and selectivity (E) of adenosine detection. A-E reproduced with permission from ref 16, Copyright 2019, American Chemical Society. (F) Experimental scheme for the detection of telomerase activity at the single-molecule level using SiMREPS. (G) Single-molecule kinetic traces in the presence (top) and absence (bottom) of telomerase activity. (H) The single-molecule assay showed a response in the presence of telomerase but not for other proteins. F-H reproduced with permission from ref 65, Copyright 2017, American Chemical Society.
