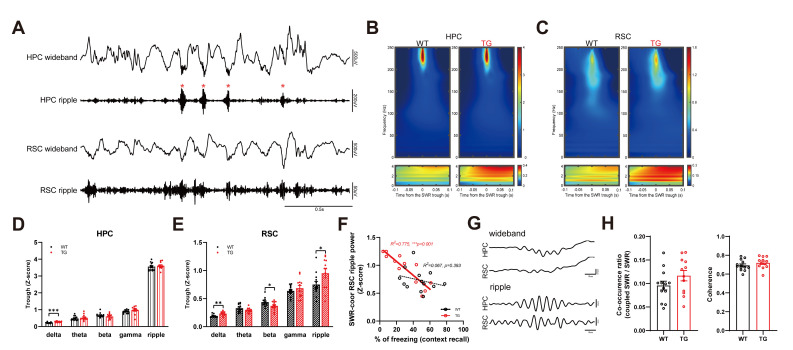
Fig. 2.
Increased amplitude of SWR coordinated RSC ripple oscillation in AD mice. (A) Example traces (wideband: 1~250 Hz, ripple: 100~250 Hz) of HPC and RSC LFPs during SWS. Sharp wave ripples (SWRs) are marked on ripple filtered HPC trace (red asterisk). Note the RSC also has a prominent amplitude change in ripple band oscillation like as HPC. (B) Grand average spectrogram of HPC LFP around SWRs. Prominent ripple band power (top panels) and delta frequency power (bottom panels) changes are detected in both of WT (n=13) and TG (n=12) mice. (C) Grand average spectrogram of coordinated RSC LFP around HPC SWR events. Similar with HPC spectrogram, RSC LFPs also show high amplitude in ripple and delta oscillations around SWRs. Color bar in panel B & C indicates the z-scored amplitude. (D) Individually quantified peak band power in HPC channel (delta: 1~4 Hz, theta: 5~10 Hz, beta: 12~30 Hz, gamma: 31~100 Hz, ripple: 100~250 Hz). Transgenic mice show significantly increased delta power compared to WT (***p<0.001, Student’s t-test). (E) Individually quantified peak band power in RSC channel. Significantly increased in ripple and delta amplitude is detected in TG mice (*p<0.05 and **p<0.01 respectively, Student’s t-test), together with reduced beta oscillation power. (F) Sharp wave ripple (SWR) corresponding RSC ripple amplitude is correlated with context recall freezing in TG mice (WT: p=0.393, TG: ***p<0.001, Pearson’s correlation). (G) Example HPC LFP trace with cortical ripple in RSC (top two traces, wideband). Retrosplenial cortex (RSC) show large ripple oscillation respond to HPC SWR (bottom two traces, ripple filtered). (H) Co-occurrence rate of HPC SWR and RSC ripple (occurred within 50 ms from the SWR trough) is equivalent between WT and TG mice (left). Coherence between SWR and RSC ripple is not changed in TG mice (right).

