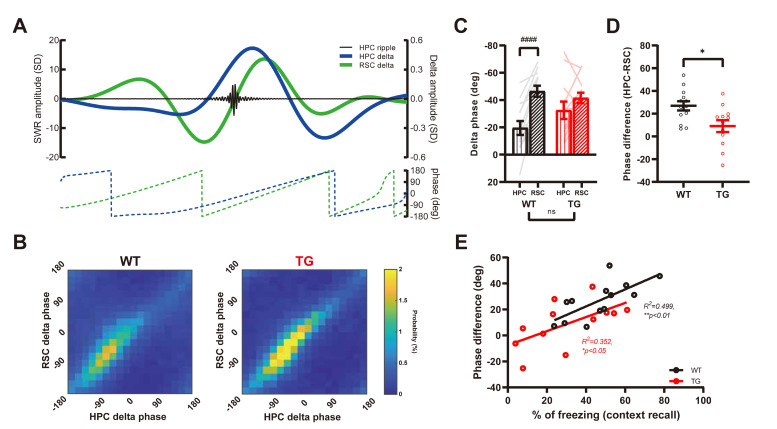
Fig. 4.
Reduced difference of SWR coordinated delta phases in AD mice. (A) Example of SWR trace (black) along with delta oscillation from HPC (blue) and RSC (green). Corresponding delta phase change is represented in below. (B) Group averaged SWR nesting delta phase in scaled matrix. The phase location of each SWR is analyzed and divided by total SWR number of each mouse. (C) Median delta phase of HPC and RSC in individual. There is no group difference in regional phase, but the regional relationship is changed (WT HPC-RSC, ####p<0.0001, paired t-test). (D) Delta phase difference between HPC and RSC is decreased in TG mice (*p<0.05, Student’s t-test). (E) Phase difference is positively correlated with context recall freezing level (WT: *p<0.05, TG: **p<0.01, Pearson’s correlation).

