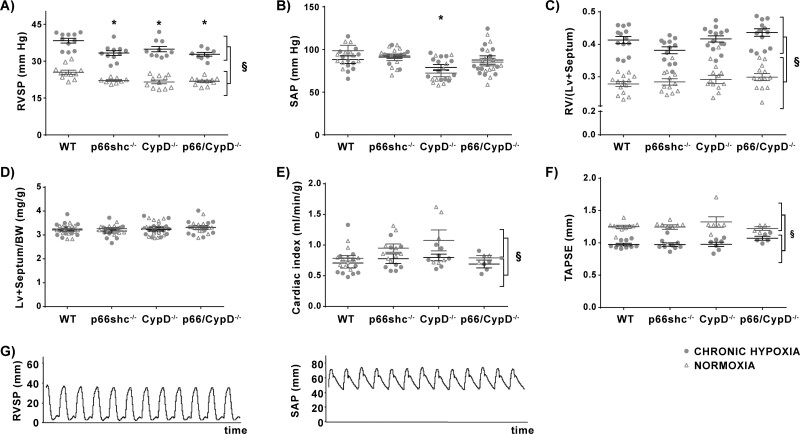
Figure 2.
Haemodynamic and cardiac parameters in p66shc−/−, CypD−/−, p66shc/CypD−/−, and WT mice after 4 weeks of exposure to hypoxia or normoxia. (A) Right ventricular systolic pressure (RVSP) in mmHg (n = 8–11 mice per group). (B) Systemic arterial pressure (SAP) in mmHg (n = 10–13 mice per group). (C) Right heart hypertrophy given as the ratio of the right ventricular mass (RV) to left ventricular plus septal mass (LV+septum) (n = 12–14 mice per group). (D) Mass of LV+septum compared to body weight (n = 17–20 mice per group). (E) Heart function given as cardiac index (CI = cardiac output/body weight) measured by echocardiography (n = 3–10 mice per group). (F) Systolic function of the RV given as tricuspid annular plane systolic excursion (TAPSE) in mm (n = 4–10 mice per group). (G) Original tracings of right ventricular systolic pressure (RVSP) in mmHg (left) and systolic arterial pressure (SAP) in mmHg (right) from a wild-type animal after exposure to chronic hypoxia (10%, 4 weeks). §P < 0.01, main effect of exposure and genotype in a two-factorial model; * P < 0.05 Tukey’s honestly significant difference test compared to wild-type mice. Data are shown as the mean ± SEM.

