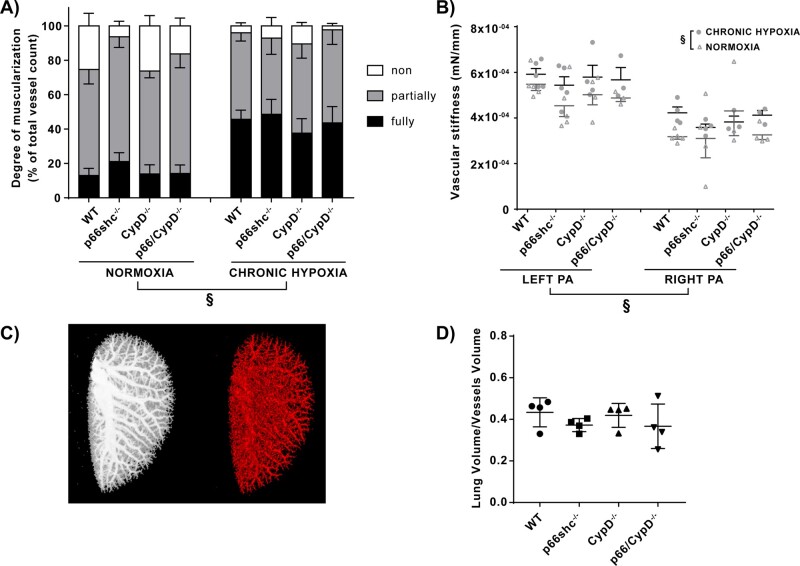
Figure 3.
Remodelling of small and large pulmonary arteries and density of the pulmonary vasculature in p66shc−/−, CypD−/−, p66shc/CypD−/−, and WT mice after 4 weeks of exposure to hypoxia or normoxia. (A) Degree of muscularisation of small pulmonary arteries. Shown is the fraction of fully, partially, and non-muscularized vessels in % of all analysed vessels (n = 4–6 mice per group). §P < 0.01, difference in the proportion of fully, partially and non-muscularised vessels, analysed by a two-factorial model of exposure and genotype. (B) Stiffness of the large extrapulmonary arteries analysed for the left and right pulmonary artery (PA) of the respective groups. The stiffness is displayed as the tangential slope of the determined stress–strain curve in mN/mm (n = 3–6 arteries per group). §P < 0.01, determined by a two-factorial model of exposure and genotype, adjusted for the site of collection (left/right PA). (C) Representative µCT images of the vascular tree of the left lungs after ex vivo Microfil® application. Left: Maximum intensity projection. Right: Reconstructed segmented pulmonary vasculature. (D) Data from (C), presented as ratio of total lung volume to volume of lung vasculature (n = 4 mice per group). No significant difference compared to WT mice was detected with Dunnett’s multiple comparison procedure. Data are shown as the mean ± SEM.

