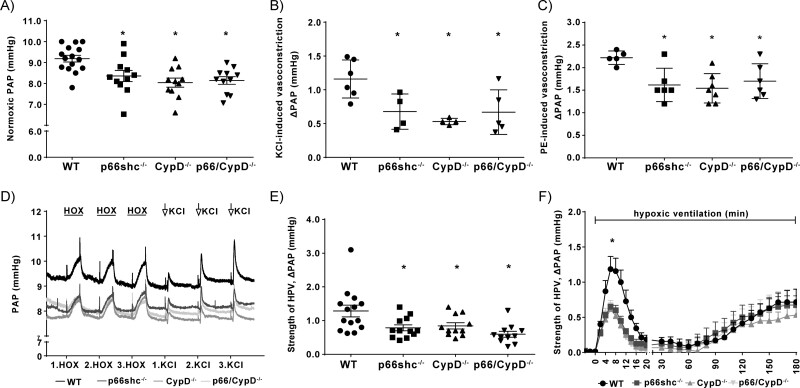
Figure 4.
Pulmonary arterial pressure response to different vasoconstrictors in isolated lungs (ILU) from p66shc-, CypD-, or p66shc/CypD-deficient mice compared to WT mice. (A) Normoxic pulmonary arterial pressure (PAP) in isolated perfused and ventilated lungs (n = 11–15 lungs per group). (B) Increase of PAP (ΔPAP) in response to stimulation with 150 mM potassium chloride (KCl) (n = 4–6 lungs per group). (C) Increase of PAP (ΔPAP) in response to stimulation with 10 µM phenylephedrine (PE; n = 5–7 lungs per group). (D) Exemplary time course of pulmonary arterial pressure (PAP) in isolated lung experiments with three repetitive manoeuvres of hypoxia (1% O2) and three repetitive stimulations with 150 mM potassium chloride (KCl). (E) Strength of acute HPV determined as the maximum increase of pulmonary arterial pressure (ΔPAP) within 10 min of hypoxic ventilation (1% O2, n = 11–14 lungs per group). (F) Time course of the strength of HPV during 180 min of hypoxic ventilation (1% O2). Changes in pulmonary arterial pressure (ΔPAP) are shown for n = 4–7 lungs per group. * P < 0.05 compared to wild-type controls, determined by Dunnett’s multiple comparison procedure. Data are shown as the mean ± SEM.

