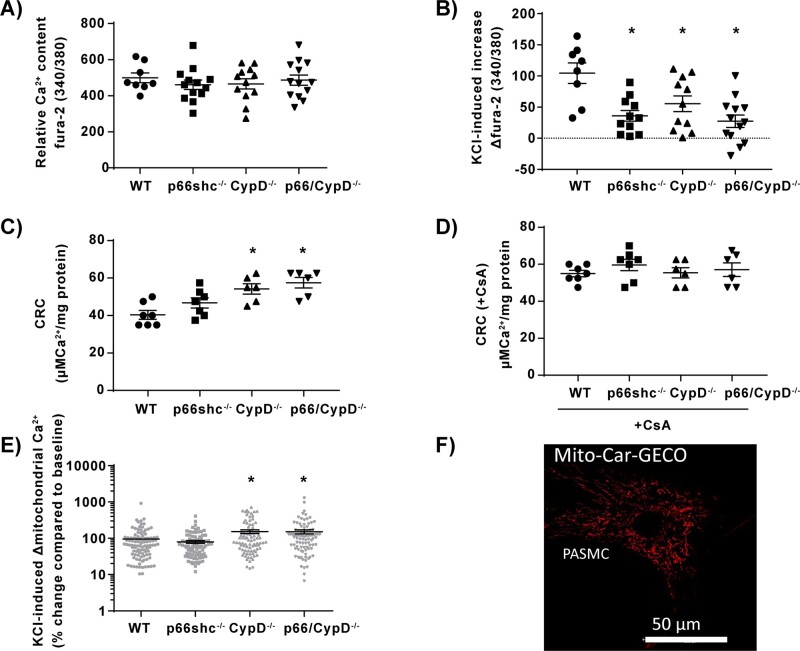
Figure 5.
Calcium handling in isolated pulmonary mitochondria and pulmonary arterial smooth muscle cells (PASMCs) from p66shc-, CypD-, and p66shc/CypD-deficient mice compared to WT mice. (A) Relative basal intracellular calcium content (Ca2+) of PASMCs quantified as the fura-2-fluorescence ratio of 340–380 nm during normoxia (n = 8–13 experiments from four cell isolations). (B) Increase of relative intracellular calcium content of PASMCs quantified as the fura-2-fluorescence ratio of 340–380 nm in response to KCl stimulation in PASMCs (n = 8–13 experiments from four cell isolations). (C) Calcium retention capacity (CRC) given as amount of calcium (Ca2+) per mg mitochondrial protein required to induce mPTP opening, detected as sudden increase in extramitochondrial calcium with calcium green 5 N fluorescence (n = 6–7 experiments, each from an individual cell isolation). (D) Calcium retention capacity (CRC) given as amount of calcium (Ca2+) per mg mitochondrial protein required to induce mPTP opening, detected as sudden increase in extramitochondrial calcium with calcium green 5 N fluorescence in presence of 1 µM of the mPTP inhibitor cyclosporin A (CsA) (n = 6–7 experiments, each from an individual cell isolation) (E) Mitochondrial calcium increase determined with Mito-Car-GECO in intact PASMCs after stimulation with 50 mM KCl detected as % change compared to baseline fluorescence (n = 10 experiments from three individual cell isolations). (F) Representative picture of PASMCs transfected with the genetically encoded dye Mito-Car-GECO; 590 nm and 620–640 nm were used for excitation and emission. *P < 0.05 compared to wild-type controls determined by Dunnett’s multiple comparison procedure. Data are shown as the mean ± SEM.

