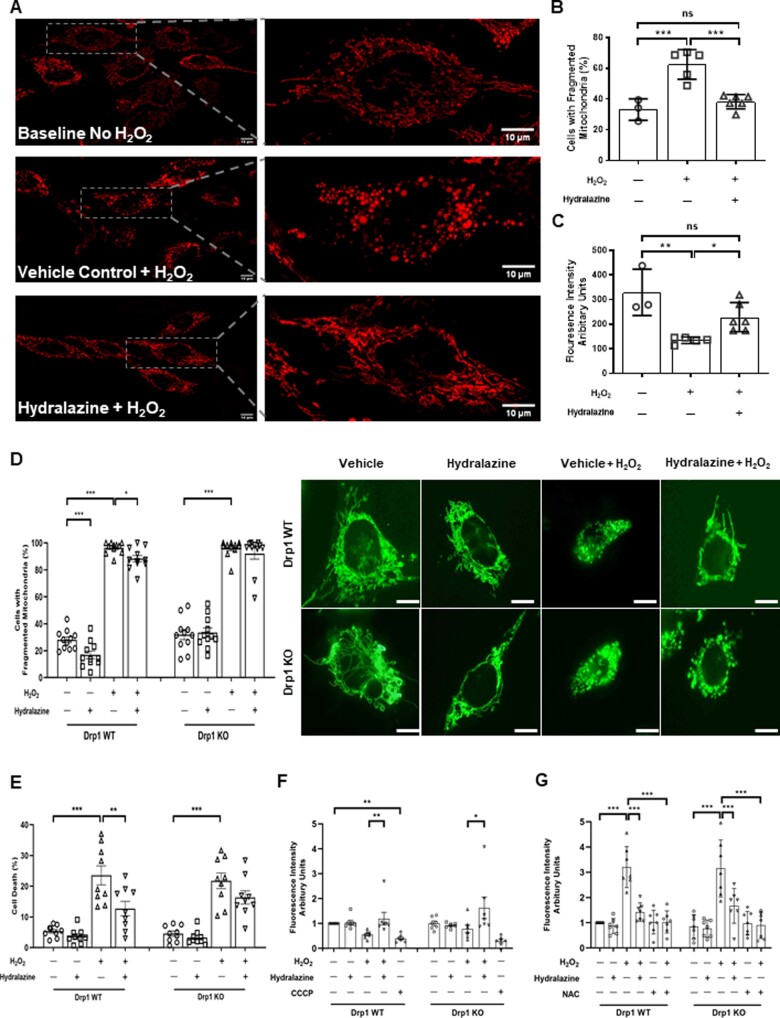
Figure 2.
Hydralazine inhibited mitochondrial fragmentation and depolarization induced by oxidative stress. (A) Representative confocal images of HeLa cells showing mitochondrial fragmentation in induced by H2O2, an effect which was attenuated in cells pre-treated with hydralazine. Scale bars are 10 µm. (B) HeLa cells subjected to H2O2 displayed more mitochondrial fragmentation when compared to baseline cells (no H2O2), and this effect was attenuated in cells pre-treated with hydralazine. Statistical analysis was performed using one-way ANOVA with Tukey’s multiple comparison post-test. Data are expressed as mean±EM. ***P=0.0002. Baseline (no H2O2), N=3 independent experiments. Vehicle control+H2O2, N=5 independent experiments. Hydralazine+H2O2, N=6 independent experiments. (C) H2O2 induced mitochondrial membrane depolarization in HeLa cells, when compared to baseline cells (no H2O2), and this effect was attenuated in cells pre-treated with hydralazine. Statistical analysis was performed using one-way ANOVA with Tukey’s multiple comparison post-test. Data are expressed as mean±SEM. *P<0.05. **P<0.01. Baseline (no H2O2), N=3 independent experiments. Vehicle control+H2O2, N=5 independent experiments. Hydralazine+H2O2, N=6 independent experiments. (D) Representative confocal images of WT and Drp1 KO MEFs. Under baseline conditions (no H2O2), pre-treatment with hydralazine reduced mitochondrial fragmentation in WT MEFs but not in Drp1 KO MEFs. In response to H2O2, mitochondrial fragmentation was increased in both WT and Drp1 KO MEFs, and hydralazine attenuated mitochondrial fragmentation in WT MEFS, but not in Drp1 KO MEFs. Statistical analysis was performed using one-way ANOVA with Sidak’s multiple comparison post-test. Data are expressed as mean±SEM. N=11 independent experiments. For Drp1 WT: *P=0.0445. **P=0.0031 for vehicle control no H2O2 vs. hydralazine no H2O2 and ***P<0.0001 for vehicle control no H2O2 vs. vehicle control+H2O2. For Drp1 KO: ***P<0.0001. Scale bars are 10 µm. (E) H2O2 induced cell death in both WT and Drp1 KO MEFs, and hydralazine significantly attenuated cell death in WT MEFs but not in Drp1 KO MEFs. Statistical analysis was performed using one-way ANOVA with Sidak’s multiple comparison post-test. N =9 independent experiments. Data are expressed as mean±SEM. For Drp1 WT: ***P<0.0001. **P<0.0018. For Drp1 KO. ***P<0.0001. (F) H2O2 induced mitochondrial membrane depolarization in both WT and Drp1 KO MEFs, and this effect was attenuated in cells pre-treated with hydralazine. CCCP was used as a positive control to induce mitochondrial membrane depolarization. Statistical analysis was performed using one-way ANOVA with Sidak’s multiple comparison post-test. N=7 independent experiments. Data are expressed as mean±SEM. For Drp1 WT: **P=0.0047 vehicle control+H2O2 vs. hydralazine+H2O2 and **P=0.0081 for vehicle control no H2O2 vs. CCCP. For Drp1 KO: *P=0.0337. (G) H2O2 induced the formation of mitochondrial ROS in both WT and Drp1 KO MEFs, and this effect was attenuated in cells pre-treated with hydralazine. N-acetyl cysteine (NAC) was used as a positive control for scavenging ROS. Statistical analysis was performed using one-way ANOVA with Sidak’s multiple comparison post-test. N=7 independent experiments. Data are expressed as mean±SEM. For Drp1 WT: ***P<0.0001 vehicle control no H2O2 vs. vehicle control+H2O2 and ***P<0.0001 for vehicle control+H2O2 vs. hydralazine+H2O2 and ***P<0.0001 vehicle control+H2O2 vs. NAC+H2O2. For Drp1 KO: ***P<0.0001 vehicle control no H2O2 vs. vehicle control+H2O2 and ***P=0.0008 for vehicle control+H2O2 vs. hydralazine+H2O2 and ***P<0.0001 vehicle control+H2O2 vs. NAC+H2O2.

