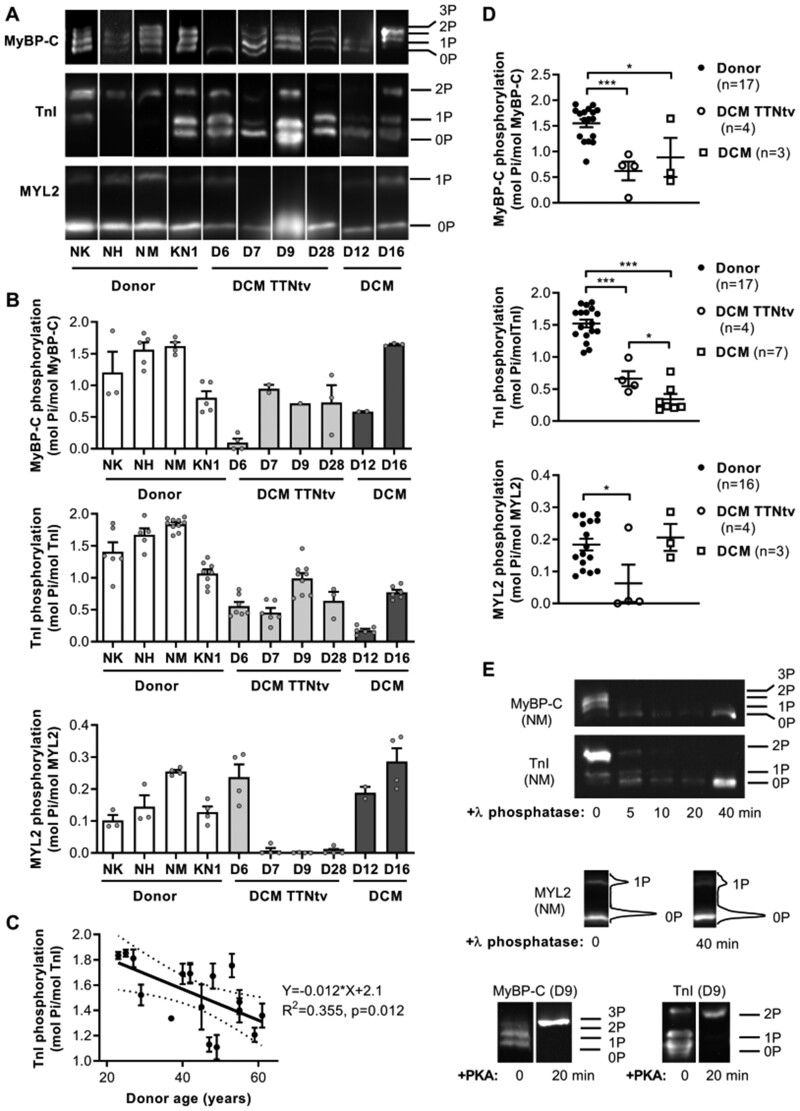
Figure 1.
Phosphorylation level of TnI, MyBP-C and MYL2 in the left ventricular myocardium of healthy donor and DCM hearts. (A) Representative western blot image of donor and DCM samples with or without TTNtv. Differently phosphorylated species of TnI, MyBP-C, and MYL2 were separated by Phos-tag SDS page gel followed by Western blotting with anti-TnI, anti-MyBP-C, and anti-MYL2 antibodies. Proteins were separated according to their phosphorylation level: tris-phosphorylated (3P), bis-phosphorylated (2P), monophosphorylated (1P), and unphosphorylated form (0P). Samples are individually plotted to illustrate the range of phosphorylation across donor and DCM heart samples. (B) The densitometric analysis of western blots is shown below each representative western blot. (C) Linear regression analysis of TnI phosphorylation in donors. The scatter plot suggests that TnI phosphorylation declines with donor age. The solid line is a least-squares linear regression line with 95% confidence interval (dotted line). (D) The level of phosphorylation of TnI, MyBP-C, and MYL2 was significantly reduced in DCM patient samples with TTNtv. Phosphorylation levels of TnI in DCM samples 4.032, 4.081, and 3.107 (referred as FA, FC, and FD) have been reported earlier.57 Statistical analysis was performed using one-way ANOVA with Fisher’s least significant difference test. *P < 0.05 and ***P < 0.001. (E) Treatment with PKA and λ phosphatase, respectively, increased and decreased the level of phosphorylation of contractile proteins TnI and MyBP-C in myofibrils. λ phosphatase treatment decreased the MYL2 phosphorylation level in NM sample from 25.4% to 18.3%.

