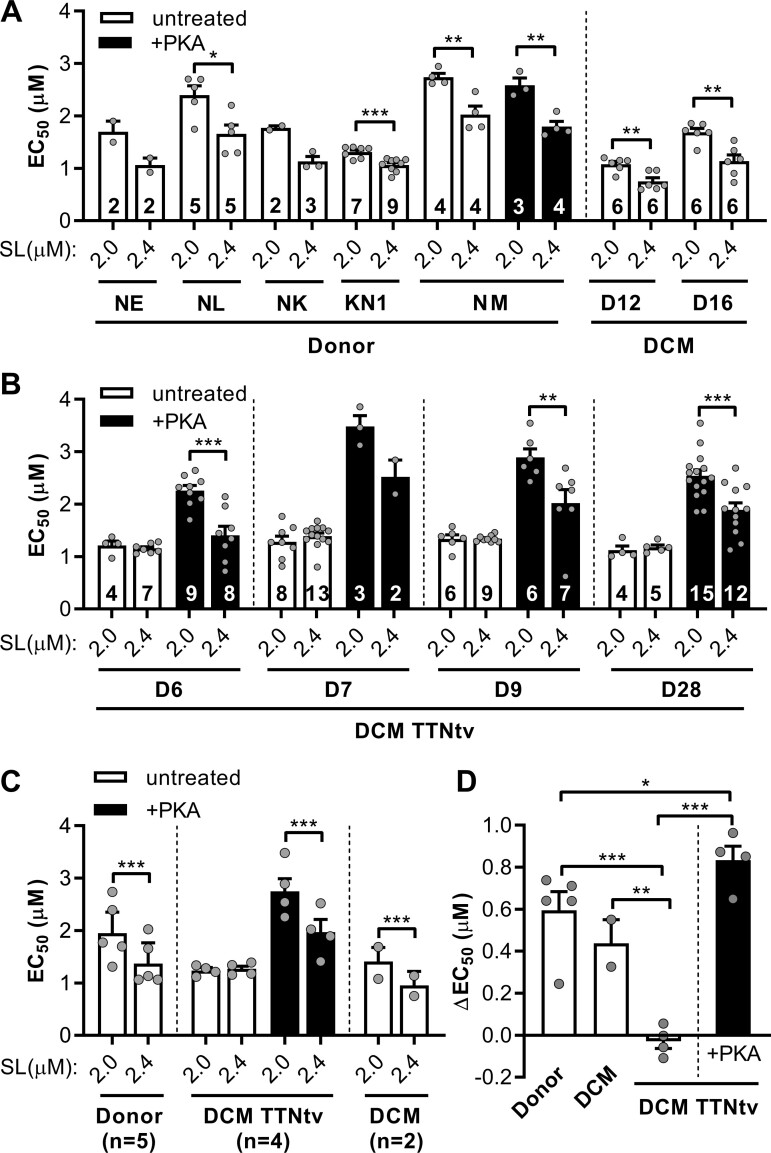
Figure 3.
Length dependence of the Ca2+ sensitivity of force. The maximum force was measured at different concentrations of Ca2+ and the EC50 required for the half-maximal activation was calculated. The measurements were performed at short (2.0 µm) and long (2.4 µm) sarcomere lengths (SL). (A) The calcium sensitivity of force (EC50) in donor heart myofibrils and DCM myofibrils without TTNtv. A significant shift in EC50 was observed both in low- and high-phosphorylated healthy donor heart and DCM without TTNtv samples. (B) Mutations in titin abolished the length-dependent changes in EC50. The changes in EC50 by stretch were restored by PKA-induced phosphorylation. Statistical analysis was performed using Student’s t-test or the Mann–Whitney U test. *P < 0.05, **P < 0.01, and ***P < 0.001. Numbers on bars indicate number of myofibril samples. (C) Statistics for the combined group of DCMs and healthy donors. Statistical analysis was performed using linear mixed model. Bars show estimated marginal means ± SE. Grey circles represent mean values of individual heart samples. (D) The difference between the EC50 values measured at 2.0 µm and 2.4 µm. Statistical analysis was performed using one-way ANOVA with Fisher’s least significant difference test. Grey circles represent mean ΔEC50 values of individual heart samples. Measurements were performed at 17°C.

