Figure 5.
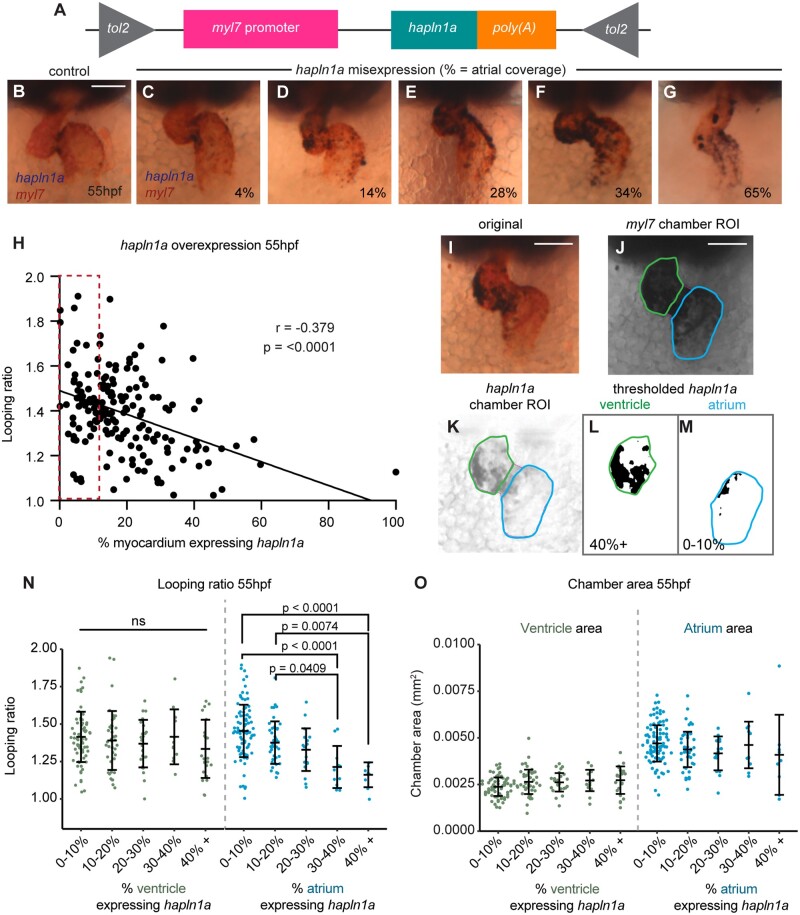
Regionalized hapln1a expression in the atrium promotes heart morphogenesis. (A) Schematic of DNA construct used to misexpress hapln1a specifically in cardiomyocytes. (B–G) Example images of heart morphology (myl7, red) upon different levels of hapln1a misexpression (blue) at 55hpf, related to the quantification method depicted in (I–M). Percentage indicates hapln1a coverage of the atrium. (H) Scatter plot depicting looping ratio as a function of percentage of the heart covered by hapln1a expression together with linear regression of the data (n = 174). Spearman’s correlation coefficient (r) deviates significantly from zero (P < 0.0001) demonstrating that increased coverage of hapln1a in the myocardium results in reduced heart looping morphogenesis. Red dashed box indicates embryos with wild-type levels of hapln1a expression. (I–M) Quantification approach to analyze pan-cardiac or chamber-specific hapln1a misexpression at 55hpf. The number of hapln1a-positive pixels within each chamber is measured alongside the total chamber area, quantifying the percentage of the chamber expressing hapln1a. (N–O) Analysis of looping ratio (N) and chamber area (O) as a function of the level of hapln1a expression in each chamber of the heart. Embryos are categorized depending on the percentage of the chamber expressing hapln1a. Misexpression of hapln1a in the ventricle does not affect looping ratio, whereas misexpression of hapln1a in the atrium significantly reduces looping ratio at ≥30% coverage (N). hapln1a misexpression in either chamber does not appear to alter overall heart size (O). ns = not significant. In both (N) and (O), atrium misexpression categories: n = 92 (0–10%); 43 (10–20%); 17 (20–30%); 12 (30–40%); 9 (40+%); ventricle misexpression categories: n = 73 (0–10%); 41 (10–20%); 25 (20–30%); 12 (30–40%); 23 (40+%). Comparative statistics carried out using a Kruskal–Wallis test with multiple comparisons.

