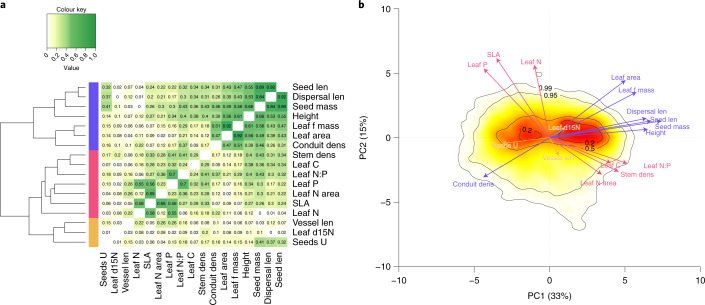
Fig. 1. Previously identified global axes of variation in size and economics traits hold for an extended trait set (n = 36,197 species per ecoregion median).
The set of 17 investigated traits (Supplementary Table 5) can be primarily divided into size and economics traits, which load differently onto the two PC axes describing their global distribution. a, Heatmap of covariation. Trait correlations are indicated using absolute Pearson correlation coefficients, with green shades indicating high absolute correlation and yellow shades indicating low absolute correlation. On the left, the distance tree of traits derived from hierarchical clustering is illustrated. Three resulting groups are: (1) size-related traits (blue) consisting of conduit density (conduit dens), leaf area, leaf fresh mass (leaf f mass), plant height (height), seed mass, dispersal unit length (dispersal len) and seed length (seed len); (2) economics traits (red) comprising SLA, leaf N content per area (leaf N area), leaf N, P and C concentrations, leaf N/P ratio (leaf N:P) and stem specific density (stem dens); and (3) a third (yellow) consisting of the number of seeds per reproduction unit (seeds U), leaf δ15N (leaf d15N) and vessel element length (vessel len). b, The first two PCs of the PCA. Arrow tips refer to the loading of the traits (Supplementary Fig. 6). Contour lines delineate the colour scale that corresponds to the kernel density of species (dense, red to sparse, light yellow; 20%, 50%, 95% and 99% of all species). PC1 explains 33% of trait variation and PC2 15% (Supplementary Fig. 5).

