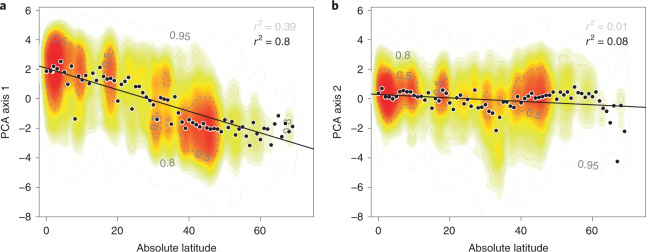
Fig. 2. Size traits, not economics traits vary with latitude: the PC1 of the PCA on 17 plant traits shows a clear latitudinal gradient while PC2 does not (n = 36,197 species per ecoregion median).
Contour lines delineate the colour scale that corresponds to the kernel density of species (dense, red to sparse, light yellow; 5%, 95%, 99% quantiles). Mean estimates aggregated at 1° absolute latitude are indicated as black dots. The line refers to a linear model (ordinary least squares). a, PC1 representing mainly size traits (conduit density, leaf area, leaf fresh mass, plant height, seed mass, dispersal unit length, seed length) regressed against absolute latitude. Linear model: r2 = 0.38 without bins; r2 = 0.84 aggregated at 1° absolute latitude. b, PC2 representing mainly economics traits (leaf N, leaf N per area, leaf P, leaf N:P ratio, SLA, leaf C, stem density) regressed against absolute latitude. Linear model: r2 = 0.01 without bins; r2 = 0.08 aggregated at 1° absolute latitude.

