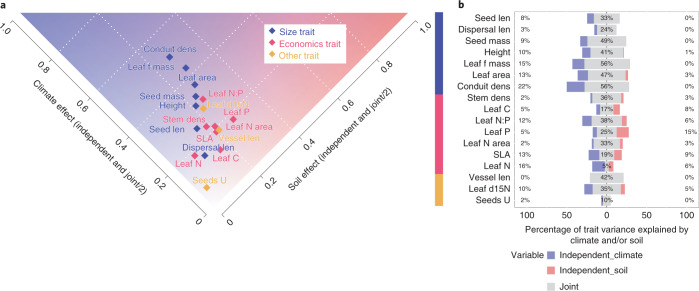
Fig. 3. Climate and soil variables explain up to 77% of variance in size and economics traits.
Hierarchical partitioning32 identifies the contribution of climate and soil variables to explain each trait (n = 220, ecoregional median trait: blue, size; red, economics; yellow, other). The joint effect is the fraction explained by both climate and soil together, and is split equally among them. The independent effect is the fraction of r2 explained exclusively by either soil or climate variables. a, Tilted x–y plot of the soil versus climate variables to explain a trait. The axes show the sum of the respective joint and independent effect (hierarchical partitioning). The colours reflect the strength of: the independent effect of climate plus its share of the joint effect (r2; purple); and soils' independent effect plus its share of the joint effect (peach). The sum of both axes equals the total r2 explained by climate and soil; in cases where soil showed a negative independent effect only the climate-independent effect is shown (and vice versa but see Table 1). b, Percentage variation explained by climate (purple, percentages on the left), soil (peach, percentages on the right) and jointly (grey, percentages in the middle) for trait groups— size, economics and other. Total bar length = total r2 explained by climate and soil; in cases where soil showed a negative independent effect only the climate-independent effect is shown (and vice versa but see Table 1). For leaf area, climate and soil jointly explain 47%, the independent climate effect explains an additional 13% of the variance, while soil explains 3%, totalling 63% of variance explained. For trait abbreviations see Fig. 1.

