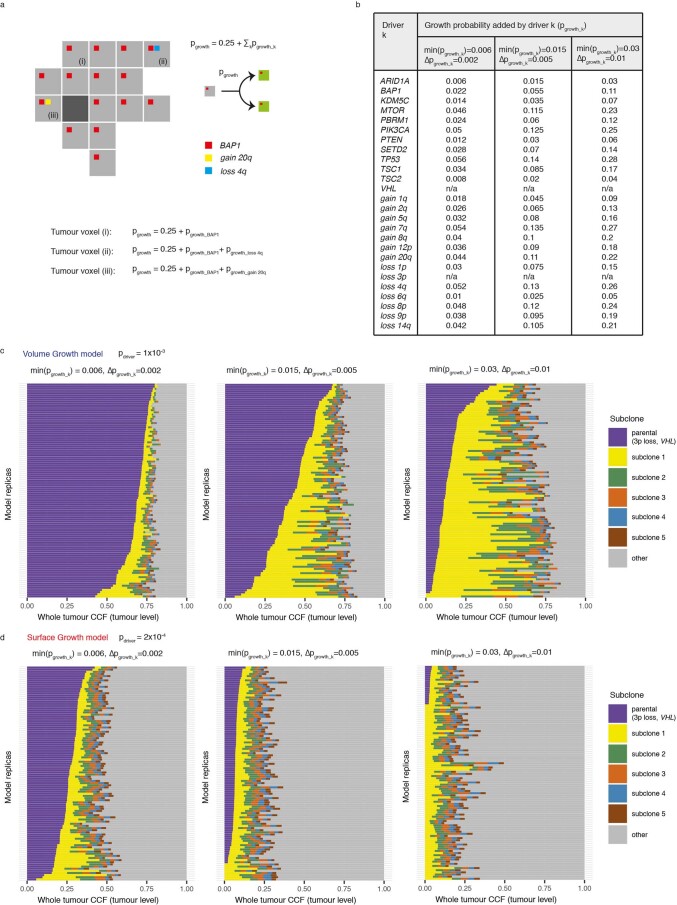
Extended Data Fig. 2. Additive model of driver advantages.
(a) Schematic figure of probabilistic growth of tumour voxels, with the growth probability of a tumour voxel cumulatively determined by the drivers harboured. (b) A table summarising the assumed amount of growth probabilities added by each driver ( for a driver k). Three scenarios were explored, indicated in the table by of the weakest driver, namely, min(), and the difference in between consecutive two drivers as in the strength of their association with Ki67 IHC score, namely, . (c-d) Whole-tumour cancer cell fraction (CCF) of parental and largest subclones in in-silico tumours under Volume Growth (c) and Surface Growth (d), respectively, under the indicated parameter conditions. ‘Parental (3p loss, VHL)’ clone is shown along with up to five subclones with a whole-tumour CCF of 0.01 or higher. All remaining subclones are represented in the ‘other’ group. N = 100 for each condition.

