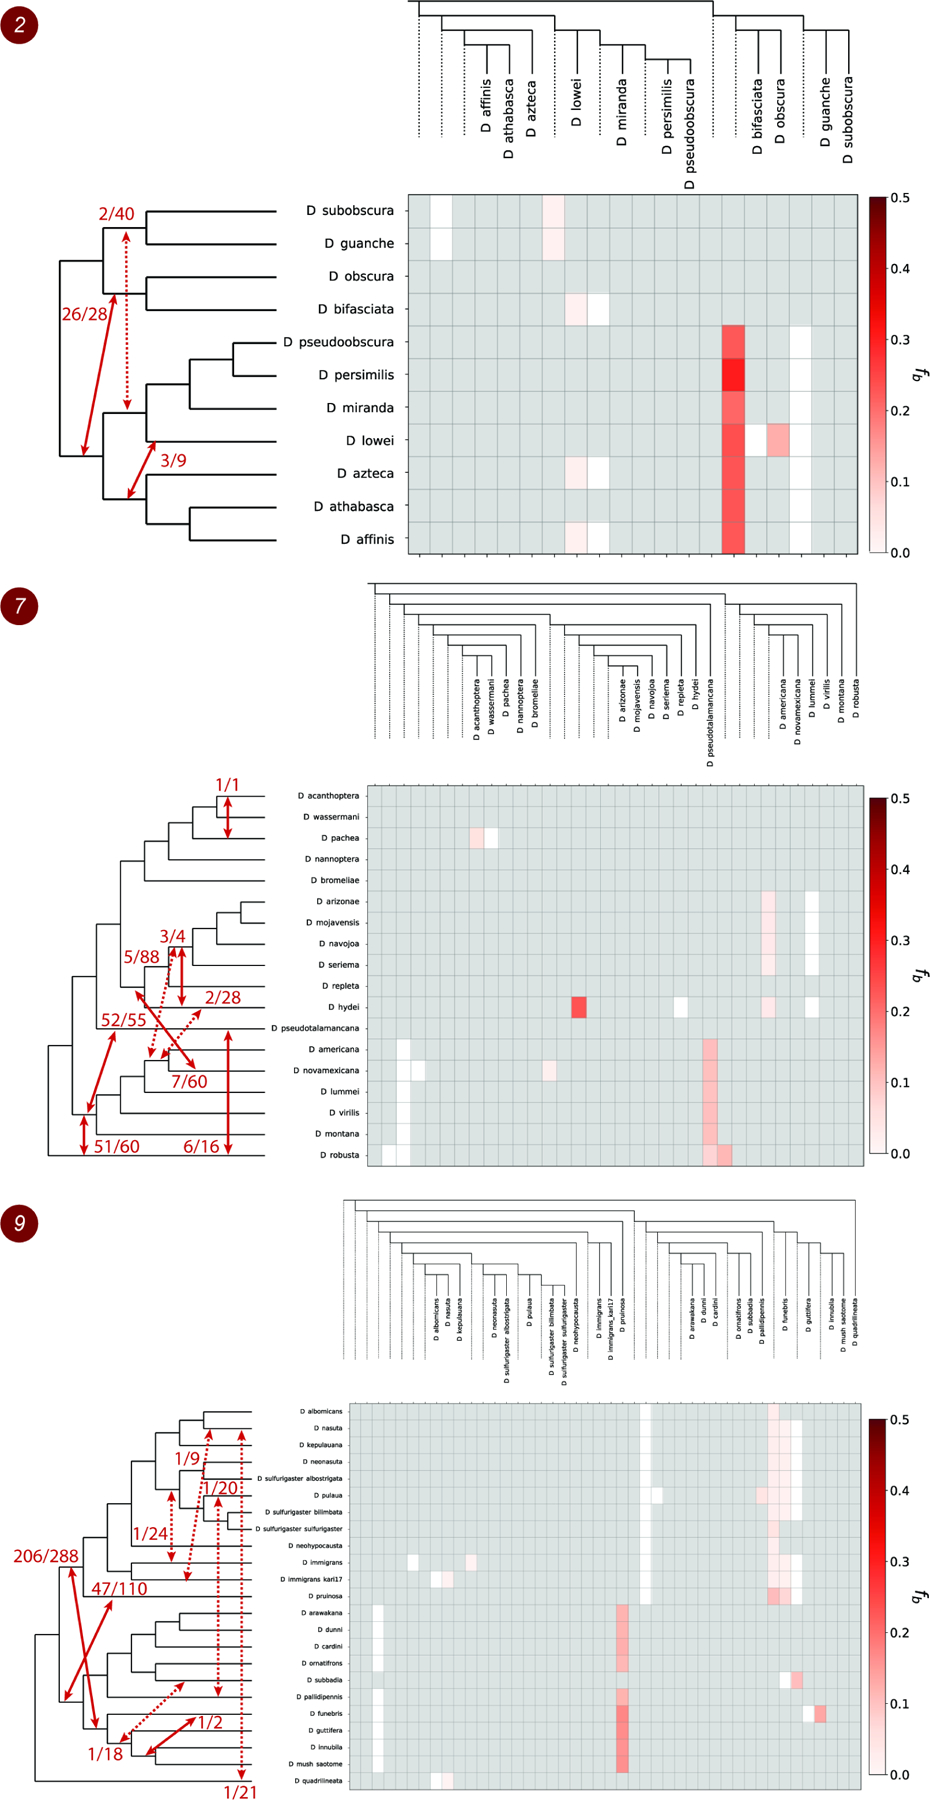
Figure 3. Patterns of introgression inferred for the monophyletic clades 2, 7 and 9.

The matrix shows inferred introgression proportions as estimated from gene tree counts for the introgressed species pairs (STAR Methods), and then mapped to internal branches using the f-branch method20. The expanded tree at the top of each matrix shows both the terminal as well as ancestral branches. The tree on the left side of each matrix represents species relationships with mapped introgression events (red arrows) derived from the corresponding f-branch matrix (STAR Methods). The fractions next to each arrow represent the number of triplets that support a specific introgression event by both DCT and BLT divided by the total number of triplets that could have detected the introgression event. Dashed arrows represent introgression events with low support (triplet support ratio < 10%). See also Figures S3–S4, Tables S1–S2 and Data S2, S4–S5.
