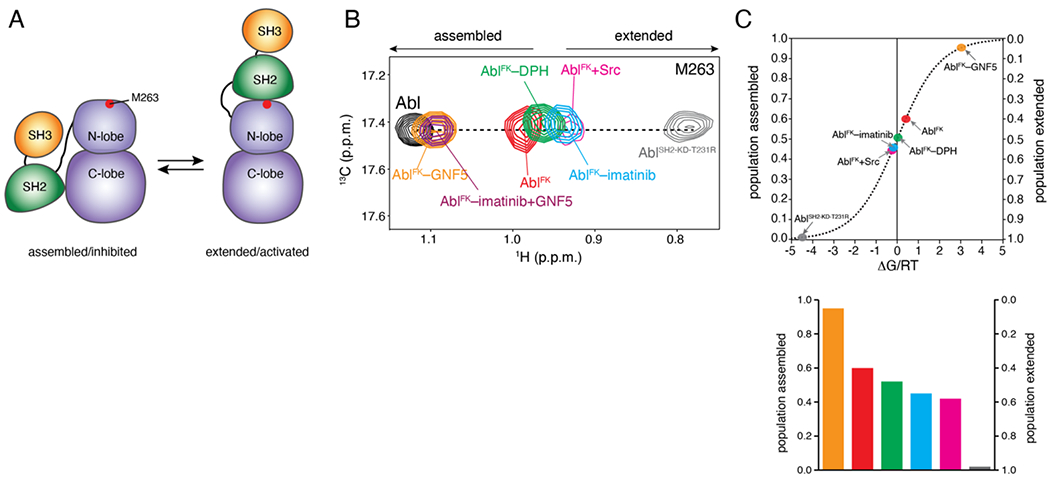
Figure 4.

Allosteric activation of Abl by imatinib. (A) Schematic showing the transition of Abl between the assembled and the extended conformational states. The position of M263 is shown as a red circle. (B) Overlaid 1H-13C methyl HMQC NMR spectra of the indicated Abl variants, showing the M263 residue. M263 is located at the interface between the SH2 and the kinase domain and provides the most sensitive probe for determining the populations of the two states in the variants, as shown previously [17]. (C) Populations of the assembled and extended states for Abl variants, determined by NMR from the spectra shown in panel B. The populations are plotted as a function of the associated free energy, ΔG/RT, where R is the gas constant, T is the temperature, and ΔG is given as GE-GA. A 0.6 kcal mol−1 change in ΔG corresponds to a change by 1 unit in ΔG/RT at room temperature. As variants approach the free-energy degeneracy (ΔG/RT=0), small changes in energy result in substantial changes in the populations.
