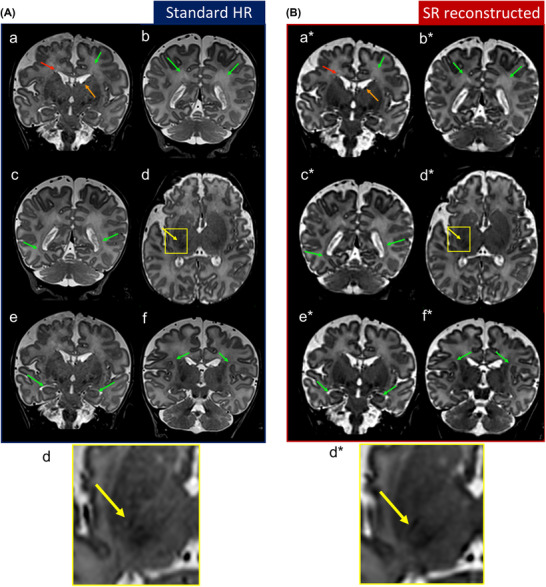
FIGURE 3.

Anatomical landmarks visibility comparison between high‐resolution (HR) scans (Figure 3A) and super‐resolution (SR) reconstructed images (Figure. 3B). The arrows indicate (a, a*) crossroad areas 2 (green), band of migrating glial and neuronal cells (red), germinal matrix (orange), (b, b*) crossroad areas 5, (c, c*) von Monakow II segments, (d, d*) posterior limb of the internal capsule myelin (yellow), (e, e*) hippocampus, and (f, f*) subplate compartments according to Pittet et al. 25 These slices were chosen to best show structures of a newborn. Only the figures on (d, d*) displayed in axial view, the rest were shown in coronal view
