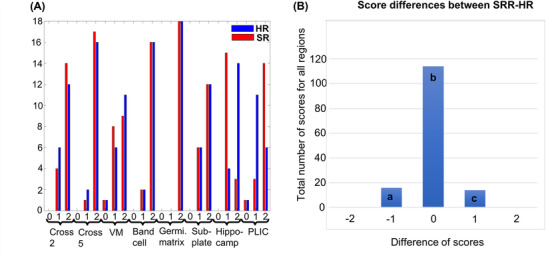
FIGURE 7.

Panel A shows the visibility scores (0 not visible, 1 visible with limitation, 2 is well visible) of the fine structures in super‐resolution reconstructed (SRR, labeled in red) and high‐resolution (HR, labeled in blue) images of each neonate (18 subjects, eight structures) and panel B shows the paired differences of the scores between SRR and HR images (SRR–HR, all regions included). Hippocampus for instance is better visible in HR, whereas PLIC is better visible in SRR images. These differences correspond to bar a and c, respectively (VM, von Monakow II; PLIC, posterior limb of the internal capsule)
