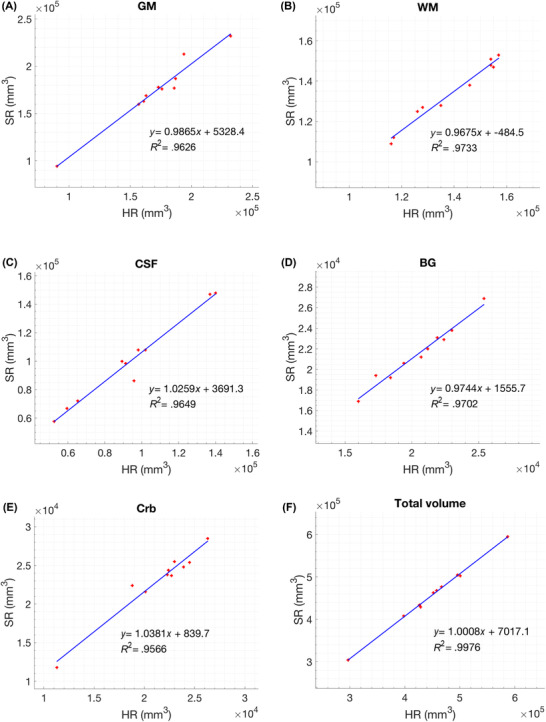
FIGURE 9.

Linear regression plots for segmented super‐resolution reconstruction and high‐resolution images of each region (GM, gray matter; WM, white matter; CSF, cerebrospinal fluid; BG, basal ganglia; Crb, cerebellum) and total brain volume including brain stem
