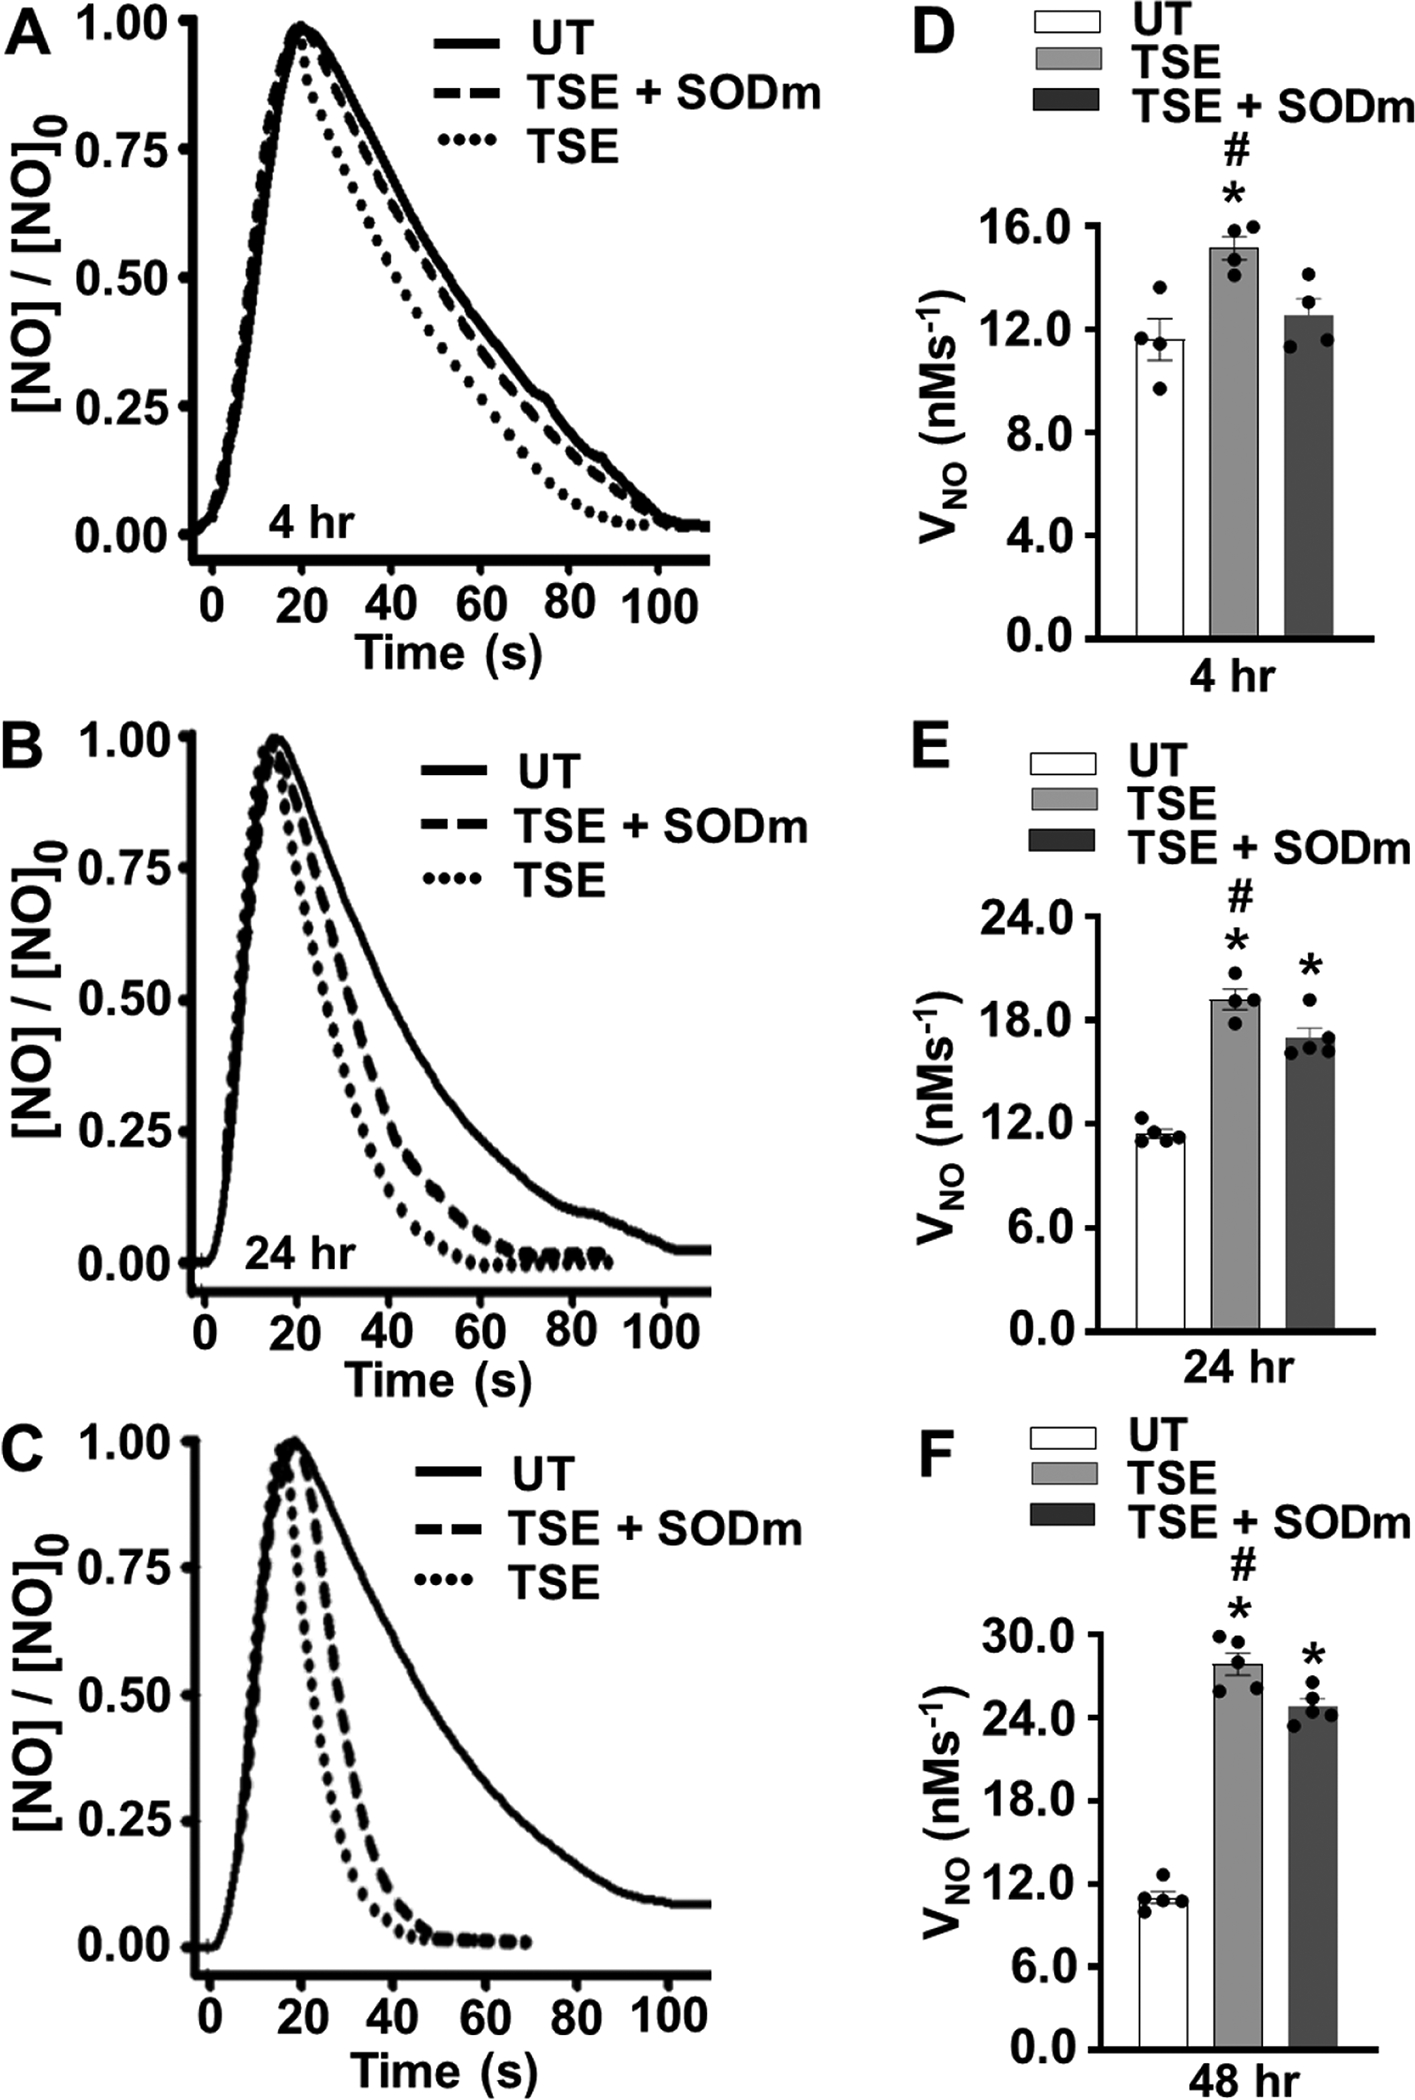
Figure 2: Effects of TSE on NO metabolism by VSMCs.

VSMCs cells were either untreated (UT) or treated with 1% tobacco smoke extract (TSE) for 4, 24 and 48 hr and then harvested for measurement of nitric oxide (NO) metabolism, with or without pre-incubation with SOD mimetic (SODm). A, B, and C, show the time course of NO decay after VSMCs treatment with TSE for 4, 24 and 48 hr, respectively. Values are shown as the ratio of the [NO] measured over time to the initial peak value, [NO]0. A cell density of 3.5 × 10⁶ VSMCs per ml was used in all groups. NO was injected into the solution to achieve an initial concentration of 1 μM. D, E and F, show the mean ± SEM of the NO metabolism rate (VNO) measured from 4–5 independent experiments. VNO was detected in VSMCs after 4, 24 and 48 hr of exposure, respectively. *: Denotes significant difference from untreated control at p < 0.05. #: Denotes significant difference from TSE-treated group in presence of SODm p < 0.05.
