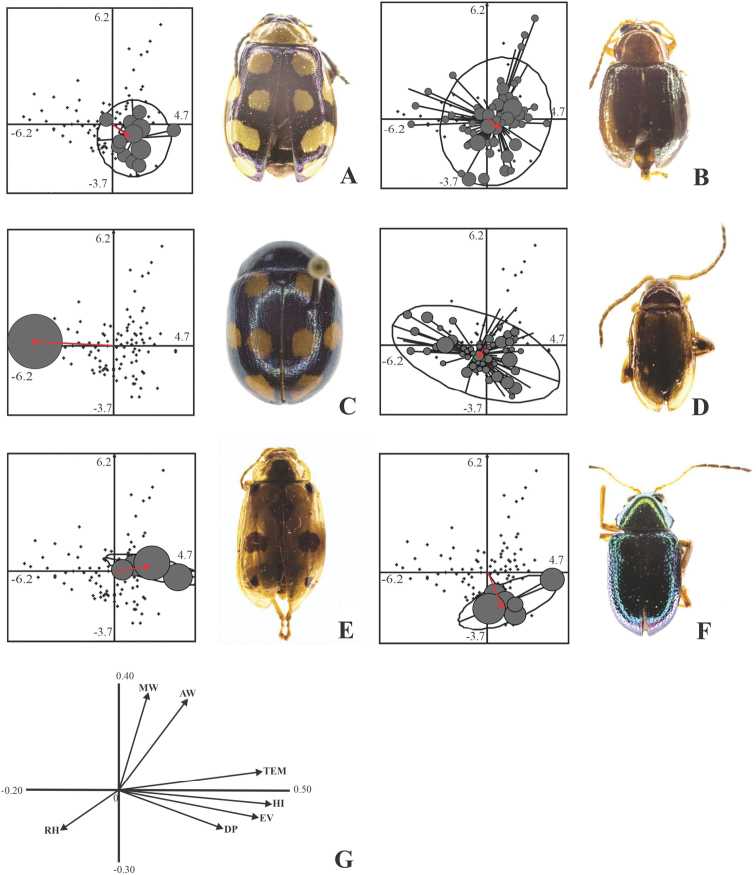
Figure 2.
Individual dispersion of leaf beetle species whose association for microclimatic variables was significant in the rainy season AAlagoasatrifasciataBCentralaphthonadiversaCLabidomerasuturellaDMonomacrabumeliaeEWalterianella sp. 1 FZenocolaspisinconstans. At each species panel: the gray circles represent the presence of the species in the sample, and the size of the circle is proportional to its abundance; straight lines represent vectors and indicate the dispersion of the species from the average position (centroid) towards each of the evaluation units where it was recorded; and ellipses represent the concentration of 95% of the specimens of the species. G canonical correlation values (loadings) between microclimatic variables and the abundance of Chrysomelidae. Abbreviations: MW: Maximum wind speed, AW: average wind speed, Tem: temperature, RH: relative humidity, HI: heat index, DP: dew point, Ev: evapotranspiration.

