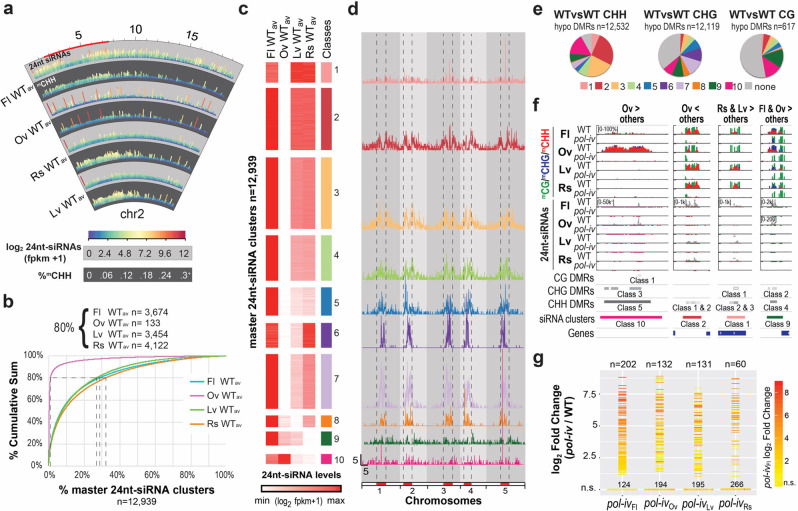
Fig. 2. Tissues with different CLSY expression patterns have distinct epigenetic landscapes.
a Circular view of chromosome 2 (chr2) showing the patterns of 24nt-siRNAs (light grey) and CHH methylation (dark grey) in 5 kb bins based on the average (av) expression of three WT controls (WTav) from each tissue. The color scales are as indicated and the tracks are labeled every 5 Mbs, with the pericentromeric heterochromatin, as designated in Yelina et al.69, marked in red. For CHH methylation, between 1 and 3 bins, depending on the tissue, had values > 0.3 (0.3+), but were capped at 0.3 to facilitate genome-wide visualization. b Cumulative sum plot based on the WTav expression levels for each tissue, showing the percentage and number (n) of 24nt-siRNA clusters (x-axis) required to reach 80% of the fpkm-normalized 24nt-siRNA reads (y-axis) in each tissue. c Heatmap showing 10 classes of 24nt-siRNA clusters based on the WTav expression levels for each tissue at the 12,939 master clusters. d Locations of the 24nt-siRNA clusters described in c along the 5 chromosomes. The pericentromeric regions are colored red and denoted by dashed lines. Scale bars for x-axis (Mb) and y-axis (clusters/100 kb bin) are indicated in the lower left corner of the Class 10 dataset. e Pie charts showing the proportions of hypo DMRs in each context that overlap with the 24nt-siRNA cluster classes colored as in c. f Screenshots of representative sites showing differential methylation between tissues. DNA methylation levels are shown as bar graphs while the 24nt-siRNAs are shown as point graphs, where the levels of 24nt-siRNAs are plotted and the regions containing 24nt-siRNAs are also underlined below the track in colors corresponding to the cluster class. Track scales, in brackets, apply to all lower tracks of the same tissue and methylation in the CG, CHG, and CHH contexts are shown in green, blue, and red, respectively. DMRs, colored based on the classes in Supplementary Fig. 4a, and 24nt-siRNA clusters, colored based on the classes in panel c, are indicated below. The > and < symbols in the headers refer to relative DNA methylation levels. g Plot showing the expression levels [log2 FC (pol-iv/WT)] of the 326 pol-iv-upregulated transcripts represented as horizontal lines (log2 FC ≥ 1 and FDR ≤ 0.05) or dots (not significantly upregulated; n.s.) in the four tissues, all colored based on the pol-iv expression level in flowers.

