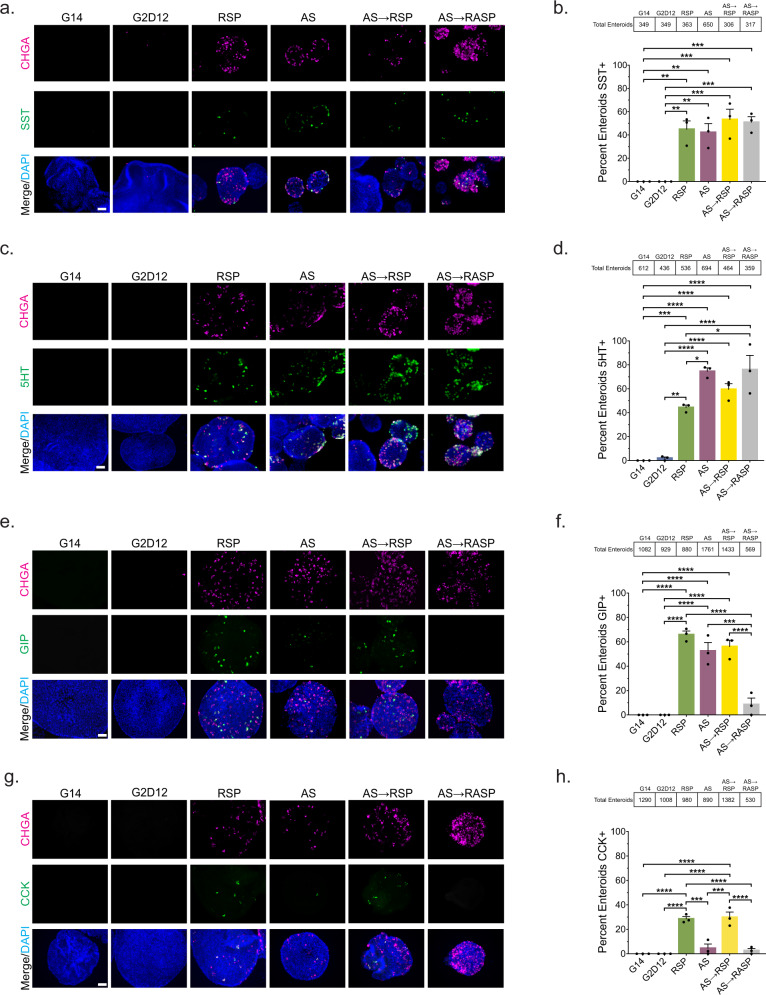
Fig. 6. Multiple differentiation conditions induce hormone production.
a Representative immunofluorescence staining of somatostatin (SST, green) and chromogranin A (CHGA, magenta) in enteroids treated with G14, G2D12, RSP, AS, AS→RSP, and AS→RASP. DNA (4′,6-diamidino-2-phenylindole (DAPI), blue). Scale bar = 50 µm. b Percentage of enteroids with SST staining in G14, G2D12, RSP, AS, AS→RSP, and AS→RASP treatments. Average results are from three different enteroid lines or passages. **p = 0.0017 (G14 to RSP, G2D12 to RSP), 0.0029 (G14 to AS, G2D12 to AS); ***p = 0.0004 (G14 to AS→RSP, G2D12 to AS→RSP), 0.0006 (G14 to AS→RASP, G2D12 to AS→RASP). c Representative immunofluorescence staining of serotonin (5HT, green) and CHGA (magenta) in enteroids treated with G14, G2D12, RSP, AS, AS→RSP and AS→RASP. DNA (DAPI, blue). Scale bar = 50 µm. d Percentage of enteroids with 5HT staining in G14, G2D12, RSP, AS, AS→RSP and AS→RASP treatments. Average results are from three different enteroid lines or passages. *p = 0.0183 (RSP to AS), 0.0134 (RSP to AS→RASP); **p = 0.0014; ***p = 0.0009; ****p < 0.0001. e Representative immunofluorescence staining of glucose-dependent insulinotropic peptide (GIP, green) and CHGA (magenta) in enteroids treated with G14, G2D12, RSP, AS, AS→RSP, and AS→RASP. DNA (DAPI, blue). Scale bar = 50 µm. f Percentage of enteroids with GIP staining in G14, G2D12, RSP, AS, AS→RSP, and AS→RASP treatments. Average results are from three different enteroid lines or passages. ***p = 0.0001; ****p < 0.0001. g Representative immunofluorescence staining of cholecystokinin (CCK, green) and CHGA (magenta) in enteroids treated with G14, G2D12, RSP, AS, AS→RSP, and AS→RASP. DNA (DAPI, blue). Scale bar = 50 µm. h Percentage of enteroids with CCK staining in G14, G2D12, RSP, AS, AS→RSP, and AS→RASP treatments. Average results are from three different enteroid lines or passages. ***p = 0.0002 (RSP to AS), 0.0001 (AS to AS→RSP); ****p < 0.0001. Bars show mean ± SEM; one-way ANOVA with Tukey correction for multiple comparisons (b, d, f, h). Tables above graphs show the total number of enteroids examined per condition. Each experiment repeated with at least three different enteroid lines. Source data are provided as a Source Data file.

