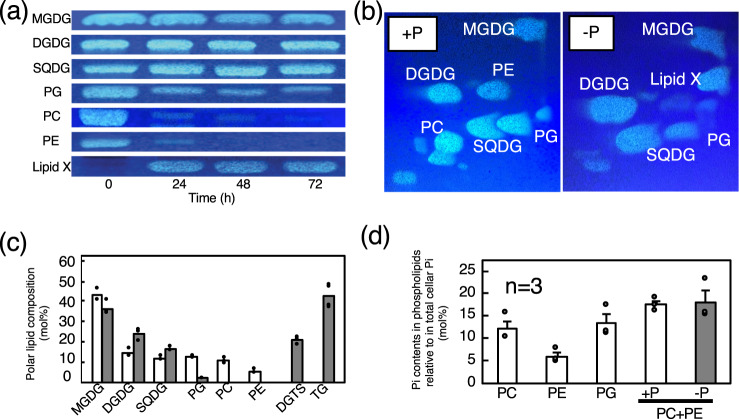
Fig. 3. Lipid remodeling in C. kessleri cells in response to −P stress.
a Qualitative TLC analysis of individual polar lipids prepared from cells grown under +P conditions (0 h), and from ones shifted to −P conditions for further growth for 24, 48, and 72 h. Respective lipids came from different regions of the plate (see Supplementary Fig. 2). b Two-dimensional TLC profile of polar lipids in the cells grown for 48 h under +P or −P conditions. c Polar lipid composition in the cells grown for 48 h under +P (white bars) or −P conditions (gray bars). The content of TG was shown as that of its constituent fatty acids, relative to total polar lipids. d The contents of Pi included in individual phospholipids, relative to that in total cellular fraction. The value as to PC + PE under −P conditions indicates the content of Pi derived from the degradation of PC and PE of +P cells, relative to that in total fraction of −P cells. The values shown are averages for two technical replicates for each of two biological replicates (c), or averages ± SEM estimated on the basis of the data in Fig. 2d (n = 3) and c. Some dots are overlapped (refer to source data in Supplementary Data 1).

