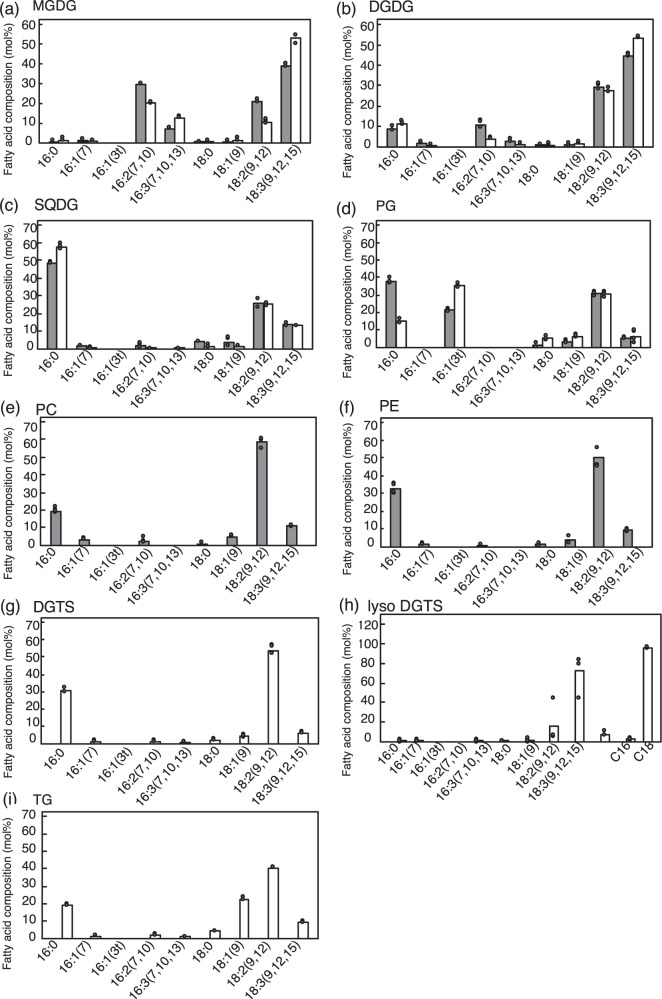
Fig. 5. Fatty acid composition of individual polar lipids.
The fatty acid compositions of MGDG (a), DGDG (b), SQDG (c), and PG (d) are shown for 48-h grown +P (gray bars) and −P cells (white bars), whereas those of PC (e) and PE (f), and DGTS (g) are for +P and −P cells, respectively. The fatty acid composition of sn-2 monoacyl lysoDGTS is shown in (h). Fatty acid composition of TG in −P cells is shown in (i). The values shown are averages for two technical replicates for each of two biological replicates. Some dots are overlapped (refer to source data in Supplementary Data 1).

