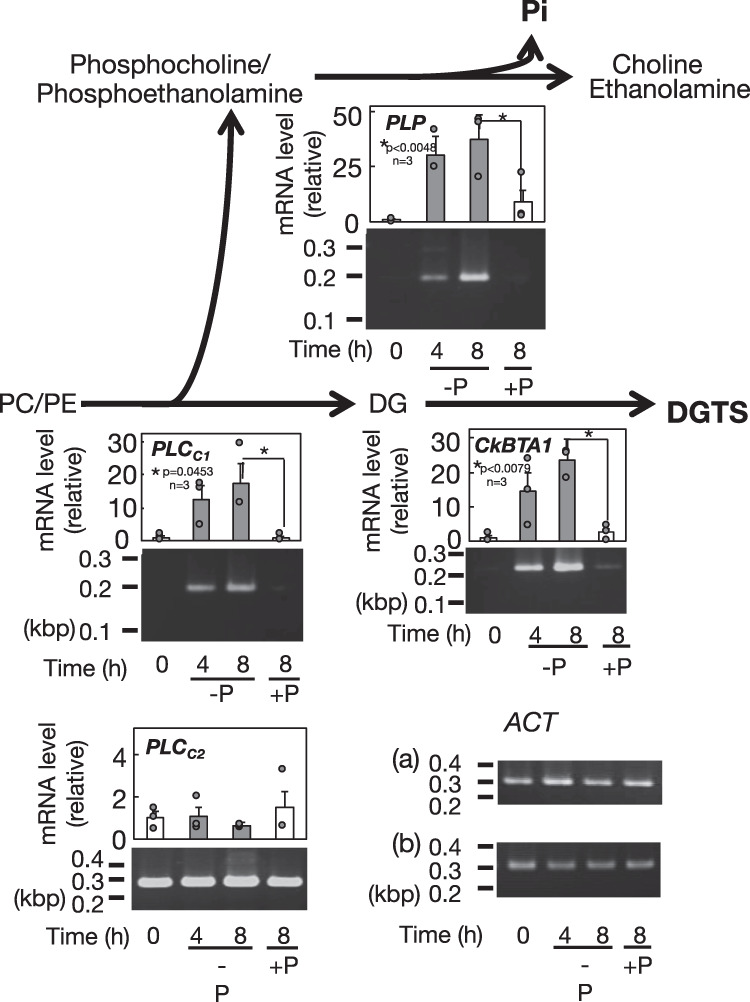
Fig. 9. Regulatory expression of the genes for −P induced lipid remodeling in C. kessleri.

The expression levels of the BTA1, PLCC1, PLCC2, and PLP genes were investigated through semi-quantitative RT-PCR analysis in C. kessleri cells before and after a shift to −P conditions. The intensities of the DNA bands that correspond to mRNAs of the individual genes were used for determination of the values, relative to that of ACT. Shown are the values relative to those at 0 h with averages ± SEM for three biological replicates. Some dots are overlapped (refer to source data in Supplementary Data 1). Data were analyzed by one-way ANOVA with multiple comparison by Tukey–Kramer’s test.
