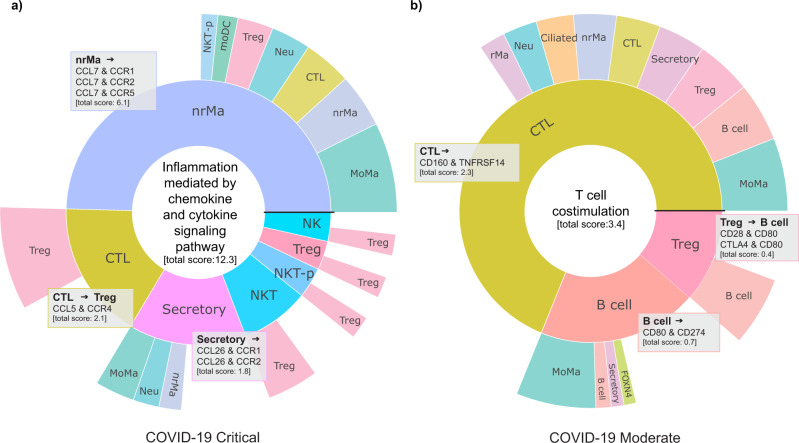
Fig. 6. Investigation of significant functional pathways and their enriched condition-specific interactions.
Sunburst plots for two condition-specific functional terms found to be significant (one-sided permutation test, p < 0.05) in the comparison between a COVID-19 critical (“Inflammation mediated by chemokine and cytokine signaling pathway”) and b moderate cases (“T cell costimulation”). Plots are generated in InterCellar’s multiple conditions module, by selecting the chosen terms from a table. Only int-pairs unique to each condition and annotated to the selected functional term are considered in the generation of the plot. For a generic int-pair ‘geneA & geneB’, enriched in ‘cluster1::cluster2’, the first cell cluster (cluster1, expressing geneA) is represented in the inner circle, while the second (cluster2, expressing geneB) is shown in the outer circle. The width of each section indicates the relative fraction of interactions (weighted by score) enriched in that cell type. Sections are arranged in descending order, counterclockwise, starting from the horizontal black line. The total interaction scores per cell type are reported in brackets. Gray boxes show the list of condition-specific int-pairs enriched for the corresponding cluster-pairs and were manually added to the figure from the downloaded files provided by InterCellar.

