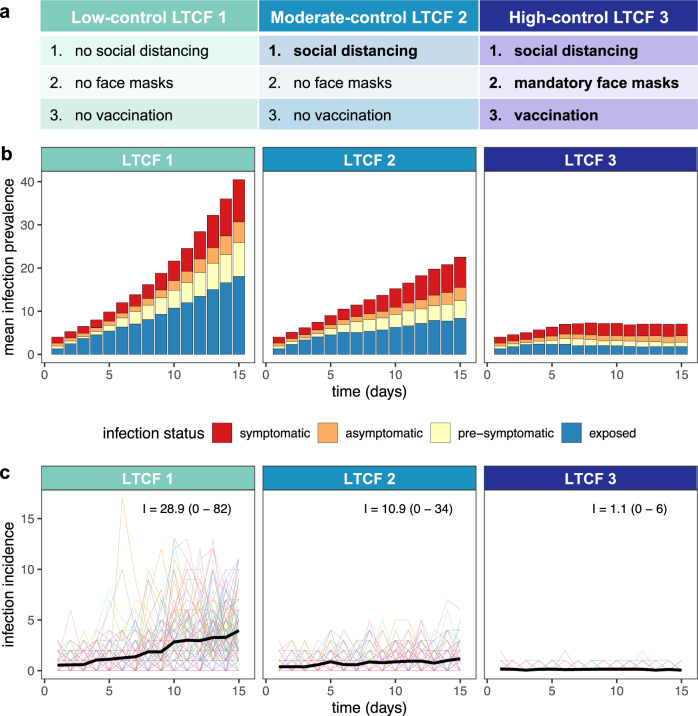
Fig. 1. Modelling context: simulating SARS-CoV-2 outbreaks in a long-term care facility (LTCF) with three different levels of COVID-19 control.
a A list of the COVID-19 containment measures in place across low-control LTCF 1, moderate-control LTCF 2, and high-control LTCF 3 (see Supplementary information section I for details). b Daily infection prevalence, the mean number of individuals in each infection stage (colours) over time. Pre-symptomatic infection combines pre-symptomatic and pre-asymptomatic infection, and symptomatic infection combines mild symptomatic and severe symptomatic infection. c Daily nosocomial infection incidence, the number of new SARS-CoV-2 infections acquired within the LTCF each day. Thin coloured lines are individual simulations; the thick black line is the mean across 100 simulations. In text, the mean (range) cumulative nosocomial incidence, I, over two weeks. The proportions of simulations with ≥1 cumulative nosocomial cases were 98%, 98% and 59% in LTCFs 1, 2 and 3, respectively; the proportions with ≥5 cumulative nosocomial cases were 91%, 73% and 2%; the proportions with ≥10 cumulative nosocomial cases were 82%, 55% and 0%; and the proportions with ≥25 cumulative nosocomial cases were 51%, 6% and 0%.

