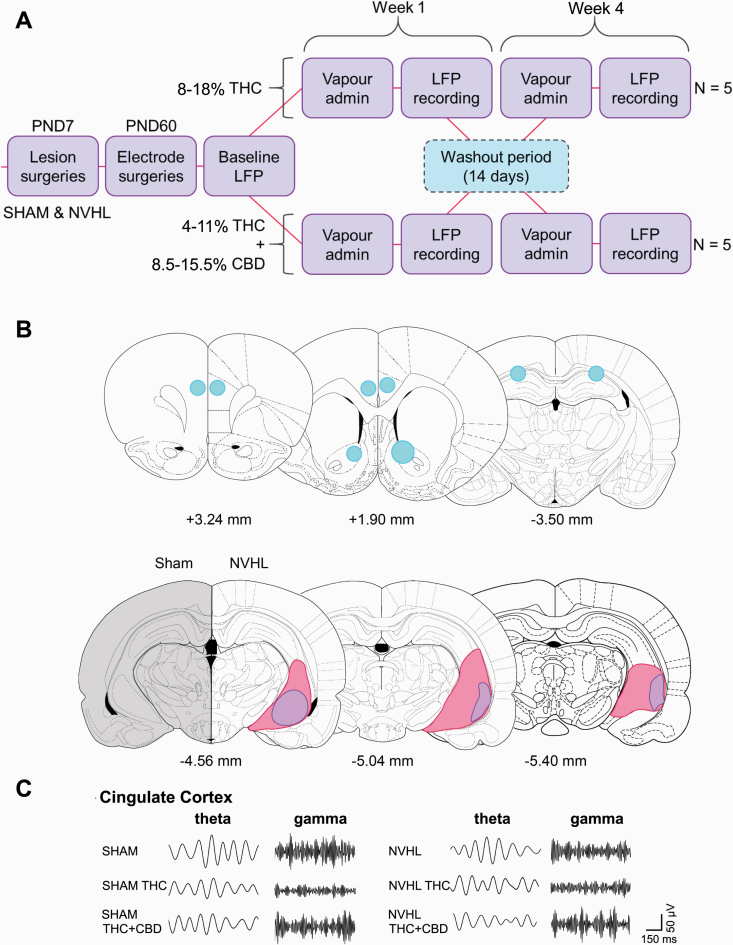
Fig. 1.
Experimental design, lesion and electrode verification, and representative local field potential tracing. A) Cross-over design with a two-week wash-out period between exposures B) Electrode placements (top) and lesion (bottom) showing electrode termini (blue) in the PrLC (left), Cg + NAc (middle), and HIP (right), as well as lesion extent in all NVHL rats (purple represents size of smallest and pink represents size of largest lesions), compared to sham controls. C) Representative tracings from the Cg showing changes in theta and gamma frequencies at baseline and after cannabis vapor exposure for both sham and NVHL rats. Figures were made using the brain schematics available from Paxinos and Watson (2007).51

