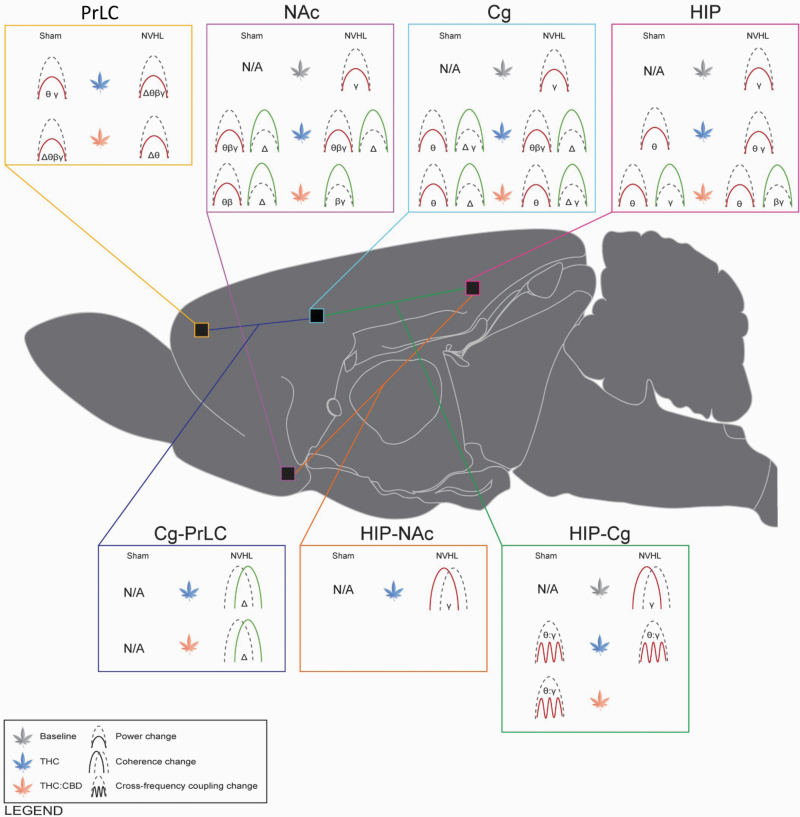
Fig. 5.
Graphical summary of power, coherence and phase coupling changes associated with NVHL lesions and cannabis vapor exposure. Cannabis vapor exposure produced constituent- and region-dependent disruptions in neural circuit oscillatory activity, often reducing theta, beta, and gamma power while enhancing delta power. Cannabis vapor exposure also enhanced coherence in cortical regions while reducing coherence and phase coupling between limbic regions. Cannabis vapor exposure further exacerbated baseline NAc, Cg, HIP gamma power deficits apparent in NVHL rats (N = 5 rats, 10 recordings per region), compared to sham controls (N = 5 rats, 10 recordings per region). PrLC = prelimbic cortex; NAc = nucleus accumbens; Cg = cingulate cortex; HIP = hippocampus. Δ = delta frequency band; θ = theta frequency band; β = beta frequency band; γ = gamma frequency band. Green = increase; red = decrease. Icons represent comparisons to sham baseline values and thus “N/A” is used for baseline sham findings. Figure was made using the brain schematics available from Swanson (2018).67

