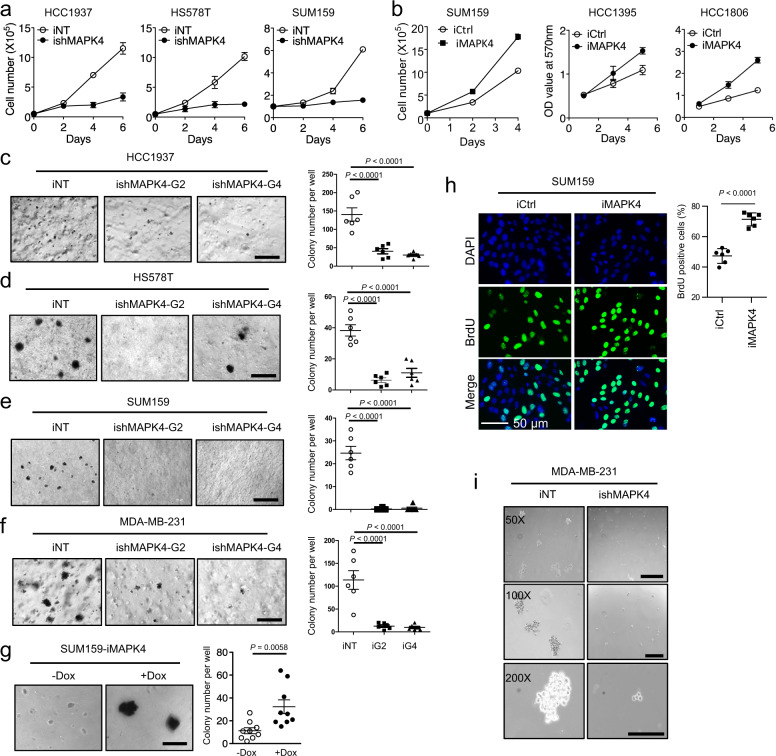
Fig. 3. MAPK4 promotes TNBC cell growth in vitro.
Proliferation assays comparing the growth of a engineered HCC1937, HS578T, and SUM159 cells with 4 μg/ml Dox-induced knockdown of MAPK4 (ishMAPK4) or control (iNT), and b SUM159, HCC1395, and HCC1806 cells with 0.5 μg/ml Dox-induced expression of MAPK4 (iMAPK4) or control (iCtrl). Soft-agar assays comparing the anchorage-independent growth of the engineered c HCC1937, d HS578T, e SUM159, f MDA-MB-231 cells with 4 μg/ml Dox-induced knockdown of MAPK4 (ishMAPK4-G2 or G4) or control (iNT), and g SUM159 cells with 0 or 0.5 μg/ml Dox-induced expression of MAPK4 (iMAPK4). Bar: 500 μm. h BrdU incorporation assays on the engineered SUM159 cells with 0.5 μg/ml Dox-induced ectopic expression of MAPK4 (iMAPK4) or control (iCtrl). Right panels in c–h show data quantification. i Mammosphere assay on MDA-MB-231 cells with 4 μg/ml Dox-induced knockdown of MAPK4 (ishMAPK4) or control (iNT). Bar: 500 μm (50X), 200 μm (100X and 200X). Data are mean ± SEM (a, c–g) and mean ± SD (b, h). P values determined by unpaired two-tailed Student’s t test and adjusted P values determined by one-way ANOVA followed by Dunnett’s multiple comparisons. Data are representative of at least three independent experiments. Source data are provided as a Source data file.

