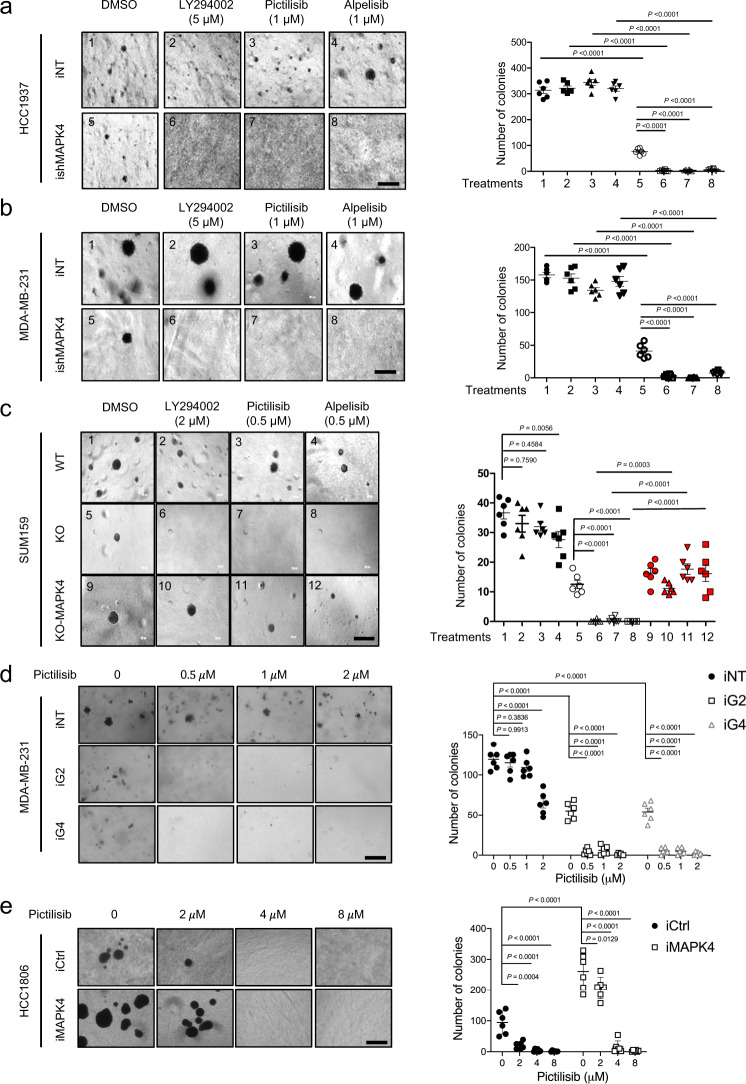
Fig. 9. MAPK4 profoundly affects the anchorage-independent growth of TNBC cells and their response to PI3K inhibitor treatments.
Representative images and quantification of soft-agar assay data of engineered a Dox-induced HCC1937-iNT and -ishMAPK4, b Dox-induced MDA-MB-231-iNT and -ishMAPK4, and c wild type (WT) and MAPK4-knockout (KO, clone #2) SUM159 cells, as well as MAPK4-KO SUM159 cells with ectopic expression of MAPK4 (KO-MAPK4). The cells were also treated with PI3K inhibitors LY294002, Pictilisib, Alpelisib at the indicated concentrations, or vehicle control (DMSO). Representative images and quantification of soft-agar assay data of engineered d MDA-MB-231 cells with 4 µg/ml Dox-induced knockdown of MAPK4 (iG2, iG4) or control (iNT), and e HCC1806 cells with 0.5 µg/ml Dox-induced overexpression of MAPK4 (iMAPK4) or control (iCtrl). The cells were also treated with increasing dosages of Pictilisib at indicated concentrations. The right panels show quantification of colonies formed under each treatment condition described/numbered in the left panels. Bar: 500 μm. Data are mean ± SEM (a–c) or mean ± SD (d, e). Adjusted P values determined by two-way ANOVA followed by Sidak’s multiple comparisons. Data are representative of at least three independent experiments. Source data are provided as a Source data file.

