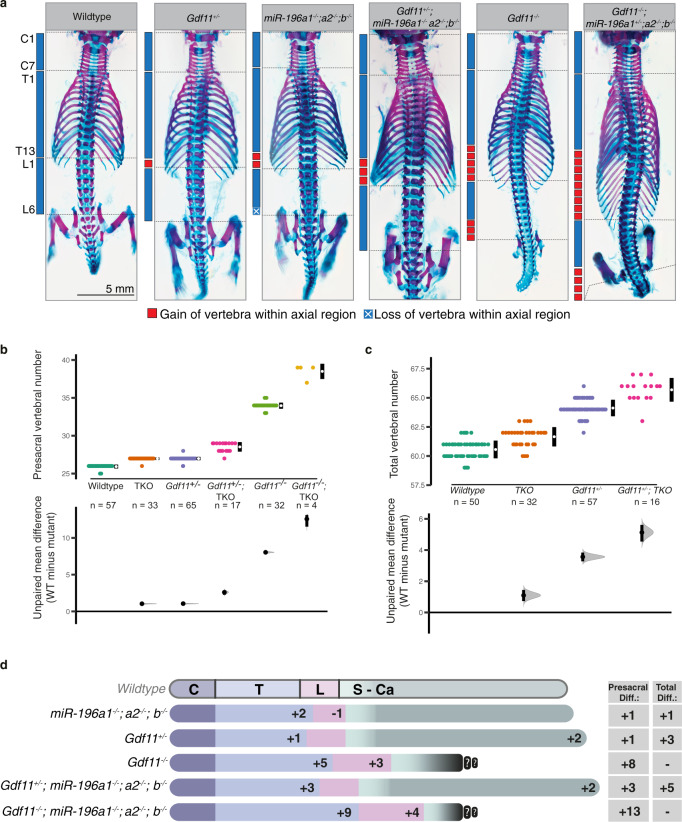
Fig. 2. miR-196 and Gdf11 act synergistically in vivo to constrain total vertebral number.
a–d In vivo characterisation of miR-196 and Gdf11 individual and compound mouse mutant skeletal phenotypes. a Representative E18.5 skeletal preparations across genotypes in dorsal view focusing on the presacral vertebral column. C = cervical; T = thoracic; L = lumbar. b, c Quantification of presacral vertebral number b, and total vertebral number c, across genotypes. Raw data is presented in the upper plot (vertical error bar = mean and standard deviation). Mean differences relative to shared reference genotype (here WT) are presented in the lower plot as bootstrap sampling distributions. Each mean difference is depicted as a dot and 95% confidence interval is indicated by the ends of the vertical error bar. n refers to the number of individual animals used for this analysis. d Schematic summary of vertebral alterations observed across the Gdf11;TKO allelic deletion series, relative to WT. Numbers represent the unpaired mean difference for a given genotype, rounded to the next whole number. Diff = difference, S-Ca = sacral-caudal vertebrae, question marks indicate dysmorphic and non-quantifiable elements. b, c Source data are provided as a Source data file.

