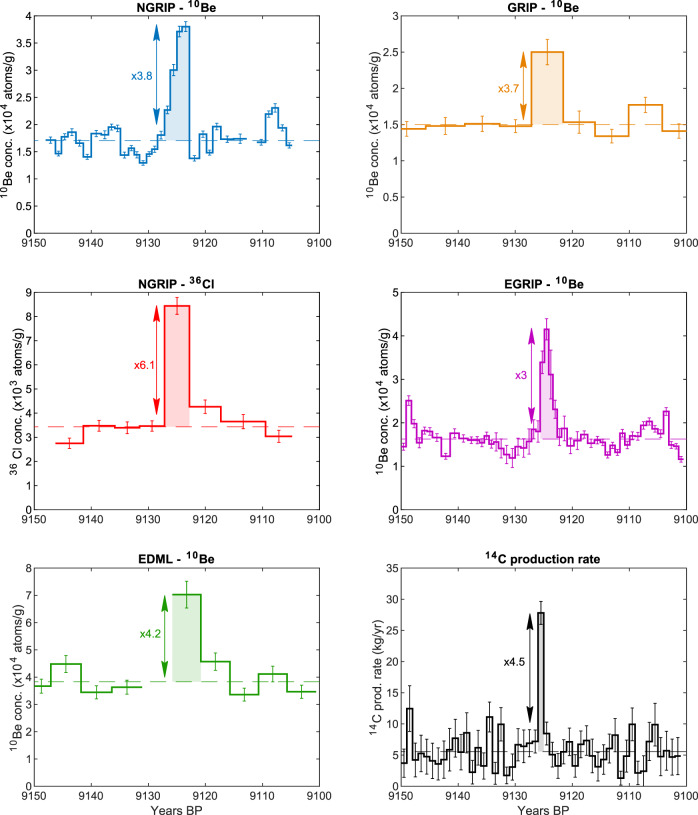
Fig. 1. Cosmogenic radionuclide records for the 9125 years BP event.
NGRIP and EDML data are shown on the left, GRIP and EGRIP 10Be data and 14C production rate24 are shown on the right. The baseline (average radionuclide concentration excluding the peak values) is shown as a dashed line. The error bar of each data point includes the measurement uncertainty. The enhancement factors (ratio between integrated enhancements in the radionuclide production and the baseline value) are noted next to the peak for each record.

